When multiple independent volcanic systems along the same tectonic arc exhibit simultaneous anomalous behavior, it may indicate a regional stress state shift rather than random coincidence, as demonstrated by the May 8, 2026 events where Mount Dukono (Indonesia) and Sakurajima (Japan) both produced significant eruptions within 7 hours of each other, with Dukono reaching 10,000 meters above its summit—approximately 7-25 times its normal baseline—suggesting a coordinated response to underlying tectonic stress changes across the Western Pacific subduction belt.
Instala nuestra extensión para buscar dentro de cualquier video al instante
Two Monster Eruptions Just Struck Indonesia and Japan — And It’s TerrifyingAñadido:
7:41 a.m. A mountain that hasn't done anything unusual in 90 years suddenly punches an ash column so high it nearly touches the stratosphere. 16 minutes, three people dead. Then silence. 7 hours later, different country, different volcano, same arc of crust. Sakurajima fires its ninth shot of the year across a city of 600,000 people. Same day, same tectonic system. And here's the part nobody's talking about yet. The last time a volcano reached the altitude Dono hit today, it cooled the entire planet for over a year. So, what exactly just happened on May 8th, 2026? Stay around because the question isn't whether something happened, it's whether it's finished. Before we go any further, if you enjoy what we do here at Project Nightw Watch, hit like and subscribe so you don't miss any of our nightly debriefs. Also, drop a comment and tell me where you're watching from. Let's get into it.
Part one, the 7-hour sequence.
Two volcanoes, one ark, one day. And somewhere in that sentence is either the most remarkable coincidence of 2026 or the opening line of something we're not ready for. Let's start with the clock because the clock is where this story gets strange.
At 7:41 in the morning, Western Indonesia time on May 8th, 2026, the sun had barely cleared the horizon over the island of Halahara.
The sky was the pale gold of early morning in the tropics, the kind of light that makes everything look peaceful. And then Mount Dukono opened up. Not in the way it usually does, not in the low, grumbling, smoky way it has been doing, almost without interruption since 1933. This was different. Within minutes, a column of gray black ash began punching upward through the morning air with the kind of energy that made vulcanologists stop what they were doing and look twice at their screens, 10,000 m above the summit. That is the number that matters here. 10,000 m above an already elevated peak sitting at 1,087 m above sea level. Do the math and you're looking at an ash column reaching approximately 11,087 m above the ocean.
That is the altitude where the troposphere ends and the stratosphere begins in the tropical atmosphere. That is not a volcanic eruption. That is a volcanic eruption standing on its tiptoes, reaching for a line that changes everything. The eruption lasted 16 minutes. 16 minutes of concentrated paracismal energy released from a volcano that has been technically erupting continuously for over 90 years.
In those 16 minutes, three climbers on its slopes were killed. Others were stranded, waiting for rescue in a cloud of ash and uncertainty on a mountain that had just reminded every human being on it that it was not their mountain at all. Then it went quiet.
And 7 hours and 34 minutes later on the other side of the Philippine Sea, the clock hit 16:15 Japan Standard Time. The sun was low in the western sky over the island of Kyushu. The light was the warm amber of late afternoon. And Sakurajima, one of the most reliably explosive volcanoes on the planet, did what Sakurajima does. It erupted. Its ninth explosion of the year, sending a column of ash 3,500 m above its crater, hurling chunks of ballistic rock between 1, and 1,300 m from its summit, scattering ash southeast toward Kagashima, a city of roughly 600,000 people who have learned to live with this particular neighbor.
In the same resigned, practiced way that people in flood planes learn to keep their furniture elevated. Two eruptions, 7 hours and 34 minutes apart, both on the same continuous arc of subduction zones that rings the western Pacific like the stitching on a baseball that has been wound too tight. Now, here is the thing about covering volcanoes.
Volcanoes erupt. That is what they do.
On any given week, there are between 15 and 25 volcanoes actively erupting somewhere on Earth. That number sounds alarming until you realize it is basically the planet's normal operating temperature. So, the fact that two volcanoes erupted on the same day is not by itself a new story. What makes this a story is the specifics. the altitude Ducono reached, the ark they both sit on, the 10 days of escalating activity that preceded both of them, and a question that no monitoring agency on Earth can currently answer with certainty. Are we watching two independent systems doing what independent systems do, or are we watching something else entirely? That question is not going to get a clean answer today. I want to be honest with you about that from the start. What it is going to get is a thorough examination. Because if there is a pattern here, you deserve to understand it. And if there is not, you deserve to understand why it looks so much like one. But before we go anywhere else, we need to talk about what Ducono actually did. Because 10,000 m is a number, and numbers without context are just numbers. The context is what turns them into something that should make you pay attention.
Part two, the Dono event. Imagine a drummer who's been playing the same quiet rhythm for 90 years. Not loudly, not dramatically. Just a steady, low frequency beat that everyone in the room has long since stopped noticing.
Background noise part of the furniture and then without warning, without a visible change in posture or expression, that drummer hits the kit with everything they have. One single explosive full body strike and then goes back to the quiet rhythm as if nothing happened. That is what Dakono did on May 8th, 2026. To understand why that matters, you need to understand what Dono's normal looks like. Mount Dakono sits in the north Malaku province of Indonesia on the island of Halahara, which is itself one of those places that does not appear on many mental maps, but sits on one of the most geologically active stretches of crust on the planet.
Dukano has been in a state of continuous eruptive activity since 1933.
That is not a typo. 90 plus years of uninterrupted volcanic activity, making it one of the longest continuously erupting volcanoes on Earth. It routinely produces ash plumes. The Indonesian Center for Volcanology and Geological Hazard Mitigation known as PVMBBG maintains an exclusion zone of 4 km around the summit. Because of this baseline activity, there are warning signs. There are protocols. Ducono is monitored, cataloged, and tracked with the kind of bureaucratic thoroughess that comes from nearly a century of being a problem. On a normal day, Ducona's ash plumes reach between 400 and 1,400 m above its summit. That is its operating range. That is the envelope within which it has been expressing itself for generations.
Volcanologists who study Ducono know this range the way a cardiologist knows a patient's resting heart rate. It is the baseline. It is what normal looks like.
On May 8th, 2026, Ducono produced a plume of 10,000 meters above its summit.
That is not an incremental increase.
That is not a worrying trend. That is an order of magnitude deviation from established behavior. If a cardiologist patient with a resting heart rate of 60 suddenly hits 600 beats per minute, we would not call that an elevated reading.
We would call that a crisis. And while volcanic systems are not human hearts, the principle of magnitude deviation applies just as cleanly. Ducono did not exceed its baseline. It detonated past it. The eruption itself lasted approximately 16 minutes. That is a short duration for what it produced, which tells us something important about the energy concentration involved. This was not a long slow exhale. This was a single violent breath. The ash column was described by observers and confirmed by satellite imagery as gray black in color, dense, and drifting northward on upper atmospheric winds. The seismic signals associated with the event range from weak to strong tremor, which is consistent with the rapid pressurized movement of material through the volcanic system. Everything about the seismic and visual profile of this eruption points to a release of accumulated pressure that had not been telegraphed clearly in advance by the monitoring data available. And here is where the human dimension enters the story because geology does not happen in a vacuum. At the time of the eruption, climbers were present on Dono slopes.
This is not as reckless as it sounds in retrospect. The 4 km exclusion zone around the summit is enforced, but the mountain is large, and its lower slopes have historically been accessible.
People climb it. They have climbed it for years. The continuous low-level activity that characterizes Ducono has paradoxically given some visitors a false sense of its predictability. If it is always erupting a little, perhaps it will not erupt a lot. That logic, unfortunately, does not survive contact with May 8th. Three climbers were killed. Others were stranded in Ashefall, requiring rescue operations to be mounted under conditions that were still dangerous and still evolving.
The gap between geological risk and human behavioral risk is almost always filled by assumption. And assumptions in the presence of a 9,000-year-old volcano are expensive. The last time Ducono produced an eruption of comparable scale was approximately 1470. A volcanic explosivity index 3 event that would have been visible and audible across a significant portion of the North Malucu region. Whether May 8th approaches or matches that historical benchmark is still under analysis by PVMBBG and international volcanological bodies, the data is being examined. But even the possibility that Dono has reached Vei3 territory is significant because VI3 events are not just bigger numbers on a chart. Due to the logarithmic nature of the V scale, a V3 releases roughly 10 times the energy of a V2 event. And a V2 is already not a small thing. So, we have a volcano with a 90-year history of controlled, predictable, continuous activity, which on one morning in 2026 produced an anomalous paroxism that killed three people, sent ash to the boundary of the stratosphere, and then went quiet. What changed? What shifted in the system? Where did that energy come from? And does the fact that Sukurajima erupted 7 hours later have anything to do with it? Hold that question because Sukurajima has its own story. and it needs to be told before we can begin to see what, if anything, connects them. Part three, the Sakurajima follow-up.
There is a special category of volcano that volcanologists refer to informally as a restless system. These are not dormant volcanoes that occasionally wake up. These are volcanoes that never really sleep. They grumble and vent and occasionally throw things, maintaining a state of persistent semi-eruption that makes them simultaneously less alarming and more dangerous than their quieter counterparts. Sakurajima is one of the most famous restless systems on Earth.
It produces hundreds of eruptions per year in active periods. Kagoshima, the city of roughly 600,000 people that sits on the shore of the Calera Bay directly across from it, has ash evacuation drills and dedicated roof cleaning infrastructure the way other cities have fire codes and snow plows. Sakurajima is part of daily life in southern Kyushu in a way that is both remarkable and to an outsider quietly terrifying. The eruption at 16:15 Japan Standard Time on May 8th, 2026 was the 9th eruption of the calendar year from Sakurajima's Minamidaka Crater. To put that in context, that number tells us we are in a period of moderately elevated activity. In peak years, Sakurajima has produced over a thousand discrete eruptions in 12 months. 9 through early May is not frantic, but it is not suppressed either. The system is active.
What the May 8th event produced was a plume rising 3,500 m above the summit crater that is notable but not exceptional for Sakurajima in an active period. The plume drifted southeast carrying ash toward the Assumi Peninsula and toward the greater Kagoshima Metropolitan Zone. Ash advisories were issued. Residents in affected areas were reminded of the same protocols they have practiced many times before. Close your windows. Wear a mask if going outside.
Be aware of reduced visibility on roads.
But here is the detail that matters more than the plume height, the ballistic ejector.
During the eruption, Sakurajima threw chunks of rock between 1,00 and 1,300 m from the summit crater. Ballistic ejector and the projectiles of the volcanic world. Unlike ash, which travels on the wind and can be directed by atmospheric conditions, ballistic rocks are thrown on fixed trajectories directly from the explosion. Their range is a direct measure of explosion intensity. The energy required to throw a multi- kg fragment of rock over a kilometer from a crater at altitude is not trivial. 1,00 to 1,300 m of ballistic range indicates a genuine explosive event, not a routine gas venting. The explosion intensity required to achieve that range is the real signal here. More than the plume height, more than the ash drift.
This was not Sakurajima clearing its throat. This was Sakurajima delivering a punch. The historical anchor for Sakurajima that everyone eventually reaches is 1914.
On January 12th of that year, Sakurajima produced one of the most significant eruptions in Japanese recorded history.
A volcanic explosivity index for event that released enormous volumes of lava connected the island of Sakurajima to the Asumi Peninsula and caused severe regional disruption. It killed dozens of people and fundamentally changed the geography of southern Kyushu. 1914 is Sakurajima's reference point the way 1981 is a reference point for Mount St. Helens or 1991 is a reference point for Pinatubo. It is the event against which all subsequent activity is measured. May 8th was not 1914. Let's be clear about that. But the timing of May 8th relative to what Ducono did 7 hours earlier is the thing that no one can explain cleanly. Two of the most active volcanoes on the Western Pacific Ark, both producing significant explosive events within a single calendar day. Not both being their worst selves, but both being notably and simultaneously expressive on the same arc of crust, and both doing so against a backdrop of other events in the surrounding region that, when you lay them out on a timeline, begin to look less like scattered data points and more like something approaching a pattern. How do you tell the difference between a real pattern and one your brain has assembled from chaos? That is the question we're going to have to reckon with. But first, let's establish what the actual pattern looks like. Because you cannot evaluate something you have not seen clearly.
Part four, the core question.
Here is what we know. Stated plainly without interpretation. On May 8th, 2026, Mount Dukano on the island of Halahara in Indonesia erupted with a plume height approximately 7 to 25 times greater than its established baseline.
The eruption lasted 16 minutes, killed three people, and sent material to the approximate altitude of the tropical tropes. On the same day, 7 hours and 34 minutes later, Sakurajima in southern Japan produced its ninth eruption of the year with a plume of 3,500 m and ballistic ejector reaching over a kilometer from the crater.
Both volcanoes sit on the continuous western Pacific subduction belt, the chain of converging tectonic plates that generate some of the most intense volcanic and seismic activity on Earth.
In the 10 days preceding May 8th, the same regional system produced Mayan volcano pyrolastic flows in the Philippines on May 2nd, a magnitude 6.0 zero earthquake in eastern Samar on May 4th, a magnitude 5.5 event near Banga on May 7th, and a seismic swarm in Papua New Guinea on May 8th itself coinciding with the two eruptions. That is a sequence of significant events spanning roughly 3,500 km of ark compressed into 10 days. Now, the default scientific interpretation of any such sequence is that active regions produce active events and that the Western Pacific is always active. This is true. It is always active. The Philippine Sea plate is always subducting. The Pacific plate is always pushing. Volcanoes along this arc are always doing something. The background noise here is higher than almost anywhere else on Earth. So when several events occur in a short window, the null hypothesis, the simplest explanation, is that you are seeing normal activity in a high activity environment and your pattern recognizing brain is connecting dots that were never meant to be connected. That might be the right answer. But the null hypothesis has a problem in this case. And the problem is Dono's altitude. When a volcano that has been producing consistent low-level activity for 90 consecutive years suddenly generates an order of magnitude anomaly without clear precursor signals, the null hypothesis earns a raised eyebrow. Consistent systems that deviate strongly even once carry information. The question is what kind of information? There are two frameworks for interpreting what happened on May 8th. The first is coincidence at an elevated baseline.
Under this model, the Western Pacific Arc is in a period of slightly heightened overall activity. And the events of the past 10 days, including the two May 8th eruptions, are all independent manifestations of that elevated baseline. They are not causing each other. They are not signaling each other. They are simply more likely to occur simultaneously because the conditions that produce each of them individually have all been slightly elevated. Individual explanations exist for every event. The pattern is an artifact of our perception. The second framework is regional stress state shift. Under this model, something has changed in the broader tectonic stress distribution along the western Pacific Ark over recent weeks or months. and the cluster of events we are observing as a series of systems responding independently but simultaneously to a changed mechanical environment. They are still not directly triggering each other, but they are all responding to the same upstream change. The way multiple trees in a forest might all drop their leaves at the same time, not because they're communicating with each other, but because they are all experiencing the same seasonal shift.
The difference between these two models matters enormously. Not because either one necessarily predicts an imminent catastrophe, but because one of them implies that the system's stress state is shifting in a way that could continue to express itself through further events. And that is not a comfortable thought. To understand why Dono's altitude makes this question so much more urgent, we need to talk about a line in the sky, a boundary that most eruptions never reach, and what happens when one does.
Part five, the tropopause threshold.
The atmosphere above your head is not a single thing. It is a stack of distinct layers, each with its own chemistry, its own temperature gradient, its own rules about how air moves and mixes. We live at the bottom of the lowest layer, the troposphere. This is where weather happens. This is where clouds form, where storms develop, where the wind that bends trees and rattles windows originates. The troposphere is dynamic, constantly churning, mixing its contents vertically and horizontally on time scales of days and weeks. Anything that gets injected into the troposphere, pollutants, water vapor, ash, eventually gets scrubbed back out. Rain washes particles down. Turbulence disperses them. The residence time of material in the troposphere is measured in days to weeks. Above the troposphere is the stratosphere, and between them is a boundary called the tropopor. The tropopause is not a wall you can see or feel. It is a transition zone where the temperature gradient that drives vertical mixing in the troposphere reverses. In the troposphere, temperature drops as you go up. Warm air rises, cool air falls, and that convective engine keeps the layer in constant motion. At the tropopause, that gradient flips. The stratosphere is warmer higher up, which means air in the stratosphere is stable. It does not convect. It does not churn. Material that enters the stratosphere does not get washed out in days. It stays. It spreads horizontally on global wind patterns and it persists. The residents time of particles in the stratosphere is measured not in days or weeks but in months to years. In the tropics where Indonesia sits, the tropopause occurs at roughly 11 to 12 km above sea level.
This is higher than at mid latitudes because the intense solar heating of the tropical atmosphere drives convection to greater heights before the gradient reversal kicks in. On May 8th, 2026, Ducono sent material to approximately 11,087 m above sea level. That is the tropopause zone. Not comfortably below it, not clearly above it, right at it, on the threshold in the zone where vulcanologists and atmospheric scientists are watching the data and asking whether any significant fraction of the erupted material, particularly the sulfur dioxide, made it into the stratosphere, or whether it topped out just below the boundary and will be washed out in the next few weeks like a normal tropospheric eruption.
The answer to that question is not yet confirmed as of the reporting on this event. The satellite data is being analyzed. Leadar measurements from regional monitoring stations are being compiled. But the fact that it is a question at all that Dakono reached the altitude where the question needs to be asked is itself significant and connects directly back to what separates a local volcanic event from a globally relevant one. Most volcanic eruptions, even fairly powerful ones, never come close to the tropopores. They inject their material into the lower troposphere and within weeks it is gone, dispersed, rained out, forgotten by the atmosphere, even if not by the people who live through it. Reaching the tropopause changes the calculus entirely. It means that a portion of the erupted material may have entered a layer of the atmosphere where it can travel globally and persist for months to years, affecting not just the region around Halah, but potentially the radiation budget of the entire planet. And this is exactly the mechanism that made one of the most consequential volcanic eruptions of the 20th century the global event it became.
Part six, the climate lever.
In June of 1991, Mount Pinatubo in the Philippines erupted in one of the largest volcanic events of the 20th century. It was a volcanic explosivity index 6 event, a colossal eruption that injected an estimated 20 million tons of sulfur dioxide directly into the stratosphere. The SO2 sulfur dioxide reacted with water vapor to form sulfate aerosols, tiny reflective particles that spread across both hemispheres on stratospheric wind patterns. Those aerosols persisted in the stratosphere for over a year, and their effect on the planet's radiation budget was measurable and significant. Global average temperatures dropped by approximately half a degree C in the year following the eruption. That is not a trivial number. Half a degree of global cooling for over a year from a single volcanic event. Disrupted monsoon patterns, changed agricultural yields, altered weather across continents. In January of 2022, the Hunga Tonga Hunga Aapai volcano in the South Pacific erupted in an event so fast and so explosive that it produced a pressure wave that circled the globe multiple times and was detectable on barometers everywhere on Earth. The Tonga eruption was notable for a different reason than Pinatubo. It injected an unprecedented volume of water vapor into the stratosphere rather than primarily sulfur dioxide. Water vapor is a greenhouse gas and the Tonga event is now being studied as a potential contributor to the anomalous warming that followed it. Though the scientific community is still working out the full accounting of its atmospheric effects.
Both events share a critical feature with what Dakono did on May 8th. They sent material across the tropopause and into the stratosphere where it could persist and act on global scales. The difference and this is important is scale of material injection. Pinatubo's 20 million tons of stratospheric SO2 dwarfs anything Ducono produced on May 8th. Dono is a smaller volcano both in terms of magma chamber volume and in terms of the total energy released in its May 8th paroxism. Even if a fraction of its ejector crossed the tropopause, the mass loading of stratospheric aerosols from this event is almost certainly not comparable to Pinatubo or Tonga. This is not a global climate event on the scale of those eruptions.
But here is the thing about thresholds and this is why Dakono's altitude connects so directly back to the central question of what May 8th actually means.
The mechanism that made Pinatubo and Tonga globally significant is not a mechanism that activates only above some arbitrary mass threshold. It is a mechanism that activates when material crosses the tropopores. The question of whether Dakono triggered that mechanism, even weakly, even partially, is a question that applies specifically because it reached the altitude it reached. If Dakono had topped out at 8,000 m, we would not be having this conversation. It would be a significant regional eruption, serious for Halmira, serious for the climbers on its slopes, but not a question about global atmospheric effects. At 11,000 m, the question has to be asked, and that brings us to an uncomfortable thought.
Not what Dakono did on May 8th, but what Dakono could do if this behavior continues or escalates.
Part seven, the near miss scenario.
Let's do something that vulcanologists do regularly, and that makes some people uncomfortable. Let's run the hypothetical forward. On May 8th, Dukano's plume reached approximately 11,087 m above sea level, placing it right at the tropical tropes. Now imagine that the same eruption had produced a plume 2 to 3 km taller. Not dramatically more energetic in terms of total volume, but with enough additional vertical velocity to push material clearly and unambiguously into the stratosphere at say 13 or 14 km altitude. What changes? The answer is a lot and potentially for a long time. At that altitude, sulfur dioxide injected by a volcanic eruption does not wash out in weeks. It converts to sulfate aerosols and spreads on Brewer Dobson circulation patterns. The large-scale wind system that moves stratospheric air from the tropics toward the poles. Those aerosols reflect incoming solar radiation, reducing the amount of energy reaching the Earth's surface. The resonance time for those particles at 13 to 14 km in the stratosphere is typically 1 to 3 years. Every day those aerosols are up there. They are acting as a partial sun shade for the planet beneath them. Now the massive material Ducano erupted on May 8th is not Pinatubo. We need to hold on to that. A Ducona scale event that fully entered the stratosphere would produce a far smaller aerosol burden than the 20 million ton injection of Pinatubo. But here is where the analysis gets interesting and a bit unsettling.
The sensitivity of the climate system to stratospheric aerosol forcing is not linear. Small injections can have disproportionate effects under certain conditions, particularly if they occur at a time when the climate system is already under stress or if they are followed by additional injections from other eruptions in rapid succession.
Think about that last part for a moment and hold it against the backdrop of what we're discussing. Multiple active systems on the same arc, a 10-day cluster of events, a question about whether the regional stress state is elevated. If ducono is part of a broader period of heightened activity and if that activity includes another eruption or series of eruptions that approach or cross the tropoporum stratospheric loading could be significant even if no single event matches pinatubo. This is not a prediction. I want to be clear about that. There is no monitoring agency or volcanologist currently predicting that Ducona will erupt again with similar or greater energy in the near term.
The volcano's behavior after the May 8th event returned to its characteristic low-level activity. But the question of what changed in the system to produce a 90-year anomaly in 16 minutes is genuinely unanswered. And unanswered questions about what drove an anomaly are uncomfortable precisely because they preclude confident statements about whether the anomaly could recur. There's also an important uncertainty about what Dono's plume actually contained.
Volcanic plume height tells you about the energy of the eruption, but it does not directly tell you about the sulfur content of the erupted material. Some magmas are rich in volatiles, particularly sulfur dioxide, and produce aerosol heavy plumes even at moderate altitudes. Others are volatile poor and produce high plumes with relatively little stratospheric chemical impact.
Takona's magma composition is known from historical sampling. But whether the material erupted on May 8th was representative of that composition or whether it drew from a different part of the magmatic system with different volatile content is a question that requires analysis of erupted ash samples that is still ongoing. The point is not that disaster happened. The point is that on May 8th, 2026, a volcano with a 90-year history of well understood bounded behavior produced an event that reached the exact altitude where the question of global atmospheric impact has to be asked. That is a near miss in any sensible use of the term. And near misses carry information. They tell you that the system is capable of reaching the threshold, which is something you did not know before. And now that you know it, the systems future behavior looks different than it did before May 8th. But here is the thing that makes Dono's anomaly even stranger when you examine it statistically.
This is not just a big eruption from a volcano that occasionally has big eruptions. This is a proxism from a system whose entire identity is defined by its consistency. Which means the statistical weight of what happened on May 8th is different from what it would be for almost any other volcano on Earth.
Part eight. Why this is statistically weird.
There is a useful distinction in volcanology between what you might call open vent systems and episodically reawakening systems. A reawakening system is a volcano that goes dormant for decades or centuries between major eruptions, builds up pressure in silence, and then produces a catastrophic event. Mount St. Helens before 1980. Pinatubo before 1991.
Long periods of quiet followed by sudden explosive resumption. These volcanoes are terrifying precisely because the quiet does not mean safe. It just means charging. Open vent systems are different. They're always venting. The conduit between the magma chamber and the surface is always at least partially open, which means pressure does not accumulate the way it does in a sealed plugged system. The continuous outgassing and low-level activity of an open vent system is in a strange way a pressure relief mechanism. It is never fully sealed. So it never builds up to the kind of catastrophic over pressure that drives a plinion eruption. Ducono is an open vent system. It has been venting continuously since 1933. By the standard model of open vent system behavior, it should not produce proxismal events of the magnitude we saw on May 8th. The plumbing is open. The pressure should not accumulate to the point where a 16-minute burst can send an ash column to the tropopores. And yet the volcanic explicity index, the VEI, is a logarithmic scale. This is important and frequently misunderstood.
A VEI3 event does not release three times the energy of a VEI2. It releases approximately 10 times the energy. A VI4 releases roughly 100 times the energy of a V2. The scale behaves the way the RTU scale for earthquakes behaves. Each integer step represents an order of magnitude increase in explosive energy.
This means that Ducono's baseline activity, which sits somewhere around V1:2, is separated from a potential V3 event by a factor of 10 to 100 in terms of energy release. That is not a modest step up. That is not Dono having a bad day. That is Dono doing something fundamentally different than what it has been doing for 90 years. The statistical weirdness of this comes from exactly that long baseline. When a volcano erupts unpredictably, a large event is within the range of expected behavior.
The system is chaotic. Big events and small events both fit the pattern. But Dono's 90-year record of consistent low-level activity has established a pattern so stable that deviations from it carry outsiz statistical weight. In statistical terms, the longer and more consistent a baseline, the more significant any deviation from it becomes. A 90-year baseline of bounded behavior followed by an order of magnitude outlier is not something that standard probabilistic models of volcanic activity assign a high probability to. The monitoring community is now asking what changed. Whether the magma supply rate beneath Dakono has increased. Whether a fresh batch of more volatile rich magma has intruded into the system. whether structural changes in the conduit or upper magmatic system have altered the pressure dynamics in a way that allowed accumulation despite the open vent configuration. These are the right questions and they do not yet have confirmed answers. What we can say is this. Dukano exceeded its own rules on May 8th. And when a system that has been playing by the same rules for 90 years suddenly breaks them, the question of why deserves serious attention, especially when you zoom out and realize that Dukano is not the only system that seems to be behaving unusually along the same stretch of crust. Because over the 10 days preceding May 8th, the Western Pacific Ark has been telling a story and it is time to read it in sequence.
Part N, the sequence before May 8th.
Let's build the timeline. Not to scare you, not to construct a narrative that is not there, but because the data deserves to be laid out in sequence and seen as a sequence, not as isolated entries in separate monitoring agency reports. May 2nd, 2026. Mayon volcano in the Philippines generates pyrolastic flows. Monon is one of the most active volcanoes in the Philippines and one of the most picturesque. Its near-perfect cone shape making it one of the most photographed mountains in Southeast Asia. Pyrolastic flows are not routine venting. They are fastmoving currents of hot gas and volcanic matter. Superheated to temperatures that can exceed several hundred° C, flowing down the flanks of the volcano at speeds that can exceed 100 kmh. They are among the most lethal products of volcanic activity. The May 2nd event prompted evacuation advisories for communities on Mayan's lower flanks.
It was a significant escalation in a volcanic system that had already been at elevated alert status.
2 days later on May 4th, a magnitude 6.0 earthquake struck eastern SM Philippines. Eastern SM sits on the Philippine sea plate within the same regional tectonic framework that drives the volcanic activity at Mayon and across the Philippine Ark. A magnitude 6.0 is a serious earthquake. It is not a micro tremor detectable only by sensitive instruments. It is an event that shakes buildings, triggers landslides, and is felt across a wide region. The Philippine Institute of Volcanology and Seismology documented it. Aftershocks followed. 3 days after that, on May 7th, a magnitude 5.5 earthquake struck near Banga in the Darva Oriental Province of Mindanao.
Baganga is in the southern Philippines, further along the ark from eastern Sama, but still within the same regional plate boundary system. Another moderate seismic event in the same general tectonic neighborhood in the same compressed time frame. And then May 8th, on the morning of May 8th, as Ducona was building toward its 741 eruption on Halahara, a seismic swarm was being recorded in Papua New Guinea to the south and east, extending the active zone along the ark. further in that direction. A seismic swarm is not a single earthquake. It is a sequence of multiple earthquakes occurring close together in time and space, often without a clear single main shock and aftershock pattern. Swarms can indicate fluid movement through rock, magmatic intrusion, or adjustment of stress in a complex fault system. There are signal that something is moving in the crust.
By the evening of May 8th, when Sakurajima had completed its 9th eruption of the year at 16:15 Japan Standard Time, the total regional picture looked like this. Significant pyrolastic activity in the Philippines, two moderate earthquakes in the Philippine Ark, a seismic swarm in PNG, and two major volcanic eruptions in Indonesia and Japan. All within 10 days, all along the same continuous subduction boundary system, all at different points on an arc stretching from the southern Pacific through Southeast Asia and up through the Japanese archipelago.
Individually, every single one of these events has a standard explanation. Mayon erupts. It has erupted over 50 times in recorded history. Eastern Sama gets earthquakes because it sits on a convergent plate boundary. Papua Newu Guinea is one of the most seismically active regions on Earth with a complex interaction of multiple plates. Ducono has been continuously active for 90 years. Sakurajima produces hundreds of eruptions annually. None of these events viewed alone requires an unusual explanation. The unusual thing is the timing, the compression. the way a span of 10 days produced not one event but a cluster of events spanning 3 and a half thousand km of the same tectonic system.
Is that unusual? Is it statistically meaningful? Or is it exactly what you would expect if you went back through the historical record and looked at comparable windows of time? That question requires a structural understanding of the system these volcanoes and earthquakes are all part of. And the structure of the western Pacific subduction belt is one of the most complex and poorly understood large-scale geological systems on the planet.
Part 10. One arc, many systems.
The Western Pacific's subduction belt is not a single thing. It is a series of interlocking interacting tectonic boundaries that together form the most seismically and volcanically active region on Earth. Understanding it requires holding several plates in your head simultaneously and tracking how they interact. The Pacific plate, the largest tectonic plate on Earth, is moving generally westward, subducting beneath the Eurasian plate to the north and west and beneath the Philippine Sea plate to the south. The Philippine Sea plate is itself subducting beneath both the Eurasian plate to the north, generating the Ruku Ark and the southern Japanese island chains and beneath the Sunda plate to the west, generating the Philippine Ark and the volcanic systems of Indonesia. Meanwhile, the Australian plate is pushing northward into the Asian land mass, driving compression through Papua New Guinea and the Indonesian archipelago. All of these plate interactions are occurring simultaneously. All of them are generating seismic and volcanic activity and all of them are interconnected through the mechanical stress state of the earth's lithosphere. Sakurajima in Japan sits on the Ruku ark generated by the subduction of the Philippine Sea plate beneath the Eurasian plate. Ducono on Halahara sits on the north Malucu ark generated by a complex interaction between the Maluca sea microp plate the Philippine sea plate and the Eurasian plate. Mayon in the Philippines sits on the Philippine ark generated by the subduction of the Philippine sea plate beneath the Philippine mobile belt.
These are distinct subduction systems.
The magma chambers beneath each of these volcanoes are fed by different portions of the subducting slab. The plumbing is not shared. There is no direct hydraulic connection between Dakono and Sakurajima. No underground pipe through which pressure in one system can directly drive an eruption in the other.
This is why standard geohysical models do not predict synchronization of activity across these systems. When we say that Dukono and Sakurajima are both on the same ark, we are speaking in the broad architectural sense of the Western Pacific subduction system. We are not implying that activity in one directly causes activity in the other in the way that squeezing one end of a toothpaste tube pushes paste out the other end. And yet the concept of stress transfer in the lithosphere is real and well documented on smaller scales. When a large earthquake occurs on one segment of a fault, it redistributes stress on neighboring segments. The culum stress transfer model, which is a standard tool in seismology, can predict which segments of a fault system become more or less likely to rupture following a major event. This is direct mechanically mediated influence but it operates over distances of tens to hundreds of kilome not thousands. The distance between Dono and Sakurajima is approximately 3,000 km. Direct colum stress transfer at that scale is not a credible mechanism for synchronized activity. What is more credible though not yet demonstrated for this specific cluster is the concept of coordinated response to a broader regional stress state change. If the overall balance of tectonic forces across the Western Pacific has shifted, not through a single large event, but through a gradual accumulation of strain over weeks or months, then multiple independent systems that were all approaching their own individual thresholds could all cross those thresholds in a compressed time frame without any of them directly triggering the others. This is what is sometimes described as a regional stress state shift, and it's the second of the two interpretive frameworks we introduced at the end of act one. The critical word in that framework is thresholds. Multiple systems approaching their individual thresholds. For that to produce a cluster, you need all of the relevant systems to be close to their thresholds at the same time. And that raises a deeper question. Is there a mechanism by which a broad region of the Earth's crust can develop a synchronized stress state, bringing multiple independent systems toward their individual tipping points simultaneously?
The honest answer from current geoysics is possibly. But we do not have the observational resolution to confirm or deny it confidently. Our monitoring networks are extensive but not comprehensive. Our models of deep crustal stress distribution are powerful but not complete. The Western Pacific is instrumented better than it was 30 years ago, but it is not instrumented well enough to definitively rule out a regional stress mechanism for the May 8th cluster.
Part 11, elevated baseline versus triggered chain.
The scientific community has two primary competing explanations for what the May 8th cluster represents, and both deserve serious examination rather than quick dismissal. The first model, which we might call the elevated baseline interpretation, begins from the observation that the Western Pacific Ark is always producing events and that the rate of events varies over time. There are quieter periods and more active periods. The transition between a quieter period and a more active one does not require a trigger or a cause.
It can simply reflect the natural variance in a system that is always on the edge. Under this model, the 10-day sequence from May and on May 2nd through the Sakurajima eruption on May 8th represents a statistical cluster within a naturally elevated activity phase.
Each event has its own independent cause. The cluster is real in the sense that more events occurred than on an average 10-day window, but the correlation between events is not causal. They are, to use the technical term, statistically independent conditional on the underlying elevated baseline. This model is scientifically conservative, well grounded in the history of volcanic and seismic monitoring and consistent with the absence of any identified coupling mechanism between the events. It is also the model that the majority of working vulcanologists and seismologists would default to in the absence of specific evidence for something else. The second model, regional stress state shift, argues that the cluster is not just a statistical fluctuation, but reflects a real change in the mechanical state of the western Pacific lithosphere. This change could be driven by any number of mechanisms. A slow slip event on a major subduction interface, a gradual redistribution of strain following a distant major earthquake earlier in the year, changes in the rate or geometry of plate convergence, or even deep mantle processes that are essentially invisible to surface monitoring. Under this model, the elevated activity we're seeing is not random variance, but a coordinated response to a changed environment. And the question of whether more events are coming depends on whether the underlying stress state shift has stabilized or continues to evolve. Neither model is definitively supported or excluded by the data currently available. Both are consistent with what we observe. The distinction between them may only become clear in retrospect after months of continued monitoring reveal whether the cluster was an isolated fluctuation or the beginning of a sustained elevated period. What makes the second model harder to dismiss than it might otherwise be is the simultaneous presence of four volcanic systems in the Philippines at elevated alert status alongside the Dukono and Sakurajima events. When you have not just two systems but multiple systems along the same ark, all showing heightened activity at the same time, the probability that this represents pure random coincidence begins to feel lower, even if the statistical case cannot yet be made rigorously. The Philippine volcano cluster comprising systems at Mayan and others at elevated alert extends the geographic footprint of the current activity episode from Japan through Indonesia through the Philippines covering essentially the entire western ark. That is a large footprint for a purely random coincidence and there is a historical precedent for periods of regionally elevated volcanic activity in the western Pacific. Though direct analogs to the specific configuration of the May 2026 cluster are hard to find. The late 1990s saw a period of heightened activity across multiple Philippine and Indonesian volcanic systems. The period around 2010 to 2014 saw elevated activity in the Western Pacific Ark coinciding with increased global earthquake rates. Whether those historical periods represented real regional stress state shifts or statistical artifacts has never been definitively resolved. The pattern is real. The cause remains unclear. And that distinction matters because it determines whether what we are watching is a weather event or a climate shift.
Part 12th. The statistical trap.
There is a fundamental tension in this kind of analysis that needs to be named clearly because it is the tension between telling you something real and leading you somewhere false. Human beings are pattern recognition machines.
We evolved in an environment where the ability to detect patterns, even in noisy data, had direct survival value.
The rustle in the grass might be a predator. The darkening sky might mean rain. The pattern-seeking brain that could extract signal from noise lived longer and reproduced more successfully than the brain that required absolute certainty before acting. This is not a design flaw. It is a feature deeply embedded and for most of human history, enormously valuable. The problem is that the same cognitive machinery that kept our ancestors alive on the savannah is now being applied to questions in vulcanology and seismology where the signal to noise problem is vastly more complex and where the consequences of false positives of seeing a pattern that is not there can include unnecessary panic, misallocated resources and eroded public trust in science. The clustering illusion is the tendency to perceive patterns in random distributions. Flip a coin enough times and you will occasionally get eight heads in a row.
That streak does not predict the next flip. The coins have no memory. But if you're watching the coin flips in real time and you have seen seven consecutive heads, your brain is screaming that the next one will be heads, too. This is not rational probability assessment. This is your pattern recognition system running hot in the presence of sequential data.
Volcanic and seismic events are not coin flips. They are not random in the simple sense that each flip is independent with fixed probability. They are generated by complex physical systems with memory with stress accumulation with thresholds and feedbacks. So the clustering illusion warning is more nuanced here than in the coin example. Some clustering is real. Aftershock sequences are a real form of clustering where an earthquake genuinely increases the probability of further earthquakes in the near term. Volcanic unrest often precedes eruptions. The patterns are not all illusions. But the global eruption rate of 15 to 25 active volcanoes per week means that any given week somewhere on Earth there are dozens of volcanic events occurring. The Western Pacific being the most volcanically active region on the planet concentrates a disproportionate share of these events.
Given a high enough background rate of events and a large enough geographic area, clustering of events within shorttime windows is not just possible.
It is mathematically expected even if no event influences any other. The question is always whether the observed clustering exceeds what you would expect from the background rate and by how much.
For the May 8th cluster, the answer to that question is probably yes. The clustering is elevated above pure background but not so dramatically elevated that it definitively excludes a statistical explanation. The pattern is real in the sense that it is unlikely to be purely chance. The cause of the pattern is genuinely unknown. And the distinction between those two statements pattern is real cause is unclear is where we need to live intellectually right now even if it is uncomfortable.
Because the temptation to jump from a real pattern to a confident causal narrative is exactly the trap we need to avoid. Not because the causal narrative is necessarily wrong, but because confidence without evidence is not knowledge. It is a story. And the Western Pacific in May 2026 deserves better than a story. It deserves careful evidence-based analysis. And part of that analysis requires evaluating the fringe explanations, the alternative theories, the non-standard causal models that always emerge when a cluster of dramatic events captures public attention. So let's look at those fairly with the physics fully in hand.
Part 13, the solar flare timing.
On May 7th, 2026 at 1514 UTC, the sun produced an Mclass 2.6 solar flare. The timing relative to the Ducono eruption at 2341 UTC that same day and the Sakurajima eruption at 7:15 UTC on May 8th works out to gaps of approximately 8 1/2 hours and 16 hours, respectively.
The observation of this temporal proximity will not be lost on certain corners of the internet and it would be intellectually dishonest to not address it directly. The M2.6 flare was not earthdirected. The active region on the sun responsible for it was not oriented toward Earth at the time of the eruption, meaning that the primary output of the flare, the electromagnetic radiation and the associated particle emission was not flowing toward our planet. Crucially, there was no associated coronal mass ejection, no CME detected in connection with this event.
A CME is the large cloud of magnetized plasma that when Earth directed can cause geomagnetic disturbances, disrupt satellites, and produce aurora at lower latitudes than usual. Without a CME impact, the geomagnetic environment at Earth on May 7th and 8th was quiet.
There was no enhanced geomagnetic activity, no elevated atmospheric electric field, no measurable energetic particle flux at ground level that could be proposed as a triggering mechanism for terrestrial geological events. The temporal correlation between the solar flare and the volcanic eruptions exists as a matter of arithmetic. The flare happened, the eruptions happened, the gaps between them are what they are. But correlation without mechanism is not causation. It is coincidence dressed in numbers. This pattern is familiar territory. Every time a cluster of seismic or volcanic events occurs, the timing gets compared to solar activity, to lunar position, to any number of external variables that happen to have data series available. Some of these correlations are real and mechanistically understood. The tidal forcing of volcanic systems by the moon, for instance, has some empirical support for certain types of eruptions, though the effect size is small and debated.
But a non-eardirected Mclass solar flare with no associated CME sits well outside the range of mechanisms that could plausibly interact with deep custal volcanic processes. And the reasons for that will become clear when we look at the energy scales involved. What the solar flare timing does serve in the context of this story is as a reminder that the search for explanations in a period of elevated dramatic events will always range widely. Not all of that ranging is fruitful. Some of it leads into territory that the physics forcloses. The challenge is to evaluate each proposed mechanism honestly using the energy budget as the primary tool and to arrive at a position that neither dismisses correlations reflexively nor embraces them credulously. With that framing established, let's look at why the physics makes external triggering of this kind of volcanic activity essentially impossible.
Part 14, the energy problem. Every physical interaction between cause and effect has an energy budget. The cause must be capable of delivering energy in sufficient quantity at the right location through a credible mechanism to produce the observed effect. This is not a philosophical principle. It is a law of conservation. Effects do not arise from insufficient causes. You cannot start a car engine by blowing on the hood. You cannot trigger a volcanic eruption by dimming the lights in the room above it. The energy released in a significant volcanic eruption ranges from approximately 10 to the 14th power jewels for a moderate event to 10 to the 16th jewels or higher for a major event.
To put that in physical terms, a 10^ the 15th jewel eruption releases roughly the equivalent of a quart of a million tons of TNT. This is not energy that responds to subtle external nudges. To trigger or significantly alter a volcanic eruption, an external forcing mechanism would need to deliver energy comparable to or exceeding the geological energy already present in the system at the point where that energy is concentrated, which is deep in the Earth's crust in a magma chamber under enormous confining pressure. Geomagnetic disturbances, the strongest of which are caused by major CME impacts, deposit energy into the upper atmosphere and the ionosphere.
Estimates of the total energy deposited by a major geomagnetic storm, a Carrington level event, are on the order of 10^ the 16th to 10 17th jewels. This sounds large, and it is large, but it is deposited diffusely across the entire upper atmosphere of the planet with vanishingly small energy density at any given point on the Earth's surface and essentially no penetration to custal depths where magma systems operate. The energy density at the relevant depth is orders of magnitude below what would be required to influence a volcanic system.
For a modest M-class solar flare with no associated CME, the energy interaction with the solid earth is so small as to be functionally zero. The electromagnetic output of the flare that's not earthdirected does not interact with the Earth's magnetosphere.
The energetic particles associated with the flare are not channeled into the Earth's interior. The entire energy budget of the mechanism is insufficient by many orders of magnitude. The capacitive coupling hypothesis which has been proposed in some fringe discussions suggest that changes in the global atmospheric electric circuit which can be influenced by solar activity might somehow influence volcanic behavior through electrical effects on magmatic systems. This hypothesis has several problems. First, the changes in the atmospheric electric circuit driven by even major geomagnetic disturbances are small relative to the natural variability of the circuit. Second, the coupling between the atmospheric electric circuit and deep geological processes is mechanistically undefined and not supported by any empirical evidence. Third, the energy scales do not work. The atmospheric electric circuit as a whole operates at power levels vastly below what would be needed to influence a magmatic system. The scientific consensus on solar seismic and solar volcanic links is clear. No reliable empirical evidence for such links exists at physically meaningful scales and the proposed mechanisms fail the energy budget test. This does not mean the topic should be dismissed with contempt. It means it should be evaluated using the same physics that we apply to everything else. and the physics says it does not work. If not external triggers, then what remains is an explanation for the May 8th cluster.
We are left with the internal dynamics of the tectonic system itself, which is both less exotic and in some ways more concerning because it points us toward the genuine unknown at the center of this story. And that genuine unknown is worth spending real time with.
Part 15, conspiracy angles.
Let's be fast and clear about this because it does not deserve more space than it gets. But ignoring it entirely would be a disservice to anyone who has already encountered these claims online.
In the hours after the Ducono and Sakurajima eruptions and actually in the hours after every significant cluster of geological events anywhere on Earth, a particular category of explanations circulated on social media and in certain alternative media spaces. The explanation invokes the highfrequency active auroral research program known as HAP or its various alleged international equivalents as a mechanism for artificially triggering geological events. The claim in its various forms is that powerful directed energy systems can inject sufficient energy into the ionosphere or into the earth's crust to trigger earthquakes and volcanic eruptions as a form of geohysical warfare or covert environmental manipulation.
The energy argument that we just walked through in the previous section dismantles this claim thoroughly and without remainder. HARP's maximum radiated power is approximately 3.6 megawatt, equivalent to roughly 3.6 * 10 6 Jew/s. The energy required to meaningfully perturb a subduction zone or a volcanic magmatic system is on the order of 10 14th to 10 16th jewels delivered precisely to a target zone buried kilome beneath the surface shielded by rock that does not efficiently conduct electromagnetic energy. The gap between what HARP can deliver and what it would take to trigger a volcanic eruption is not a close call. It is a gap of 8 to 10 orders of magnitude. That is a factor of 100 million to 10 billion times insufficient energy. The monitoring data for Ducono and Sakurajima is public published by PVMBBG in Indonesia and by the Japan Meteorological Agency respectively. Multiple independent monitoring networks in different countries with different institutional affiliations all show the same picture.
There is no hidden data. There is no suppressed record. There is no version of events in which the monitoring agencies have a unified interest in presenting false information while independent citizen observers have access to truth. The data is transparent, reproducible, and consistent across independent sources.
The artificial triggering hypothesis fails the energy test, fails the mechanism test, and fails the evidence test. It deserves a clear statement of this and then we move on because the genuine uncertainty about what drove the May 8th cluster is interesting enough without inventing false explanations to fill it. What we actually do not know and what that not knowing means is the real story.
Part 16, the real unknown.
Strip away the fringe explanations.
Strip away the cosmic coincidences and the conspiracy theories and the energy budget impossibilities. Strip away the pattern recognition traps and the statistical illusions. What you're left with when you look at May 8th, 2026 cleanly and honestly is a legitimate and unresolved scientific question. The question is this. Did the Western Pacific Ark experience a regional stress state shift in the weeks preceding May 8th? And if so, what drove it? And what does it imply about the evolution of the system in the coming weeks and months?
Let's be precise about what we know and do not know. We know that Dono produced an anomalous eruption that exceeded its 90-year baseline by an order of magnitude. We know this is statistically significant, not as proof of anything external, but as a real deviation from expected behavior within the system. We know that 7 hours later, Sakurajima produced a notable explosive eruption with ballistic ejector indicating genuine explosion intensity. We know that these two events occurred against a backdrop of heightened seismic and volcanic activity across the Philippine Ark over the preceding 10 days. We know that multiple Philippine volcanic systems are at elevated alert status. We do not know whether these events are causally connected. We do not know whether they reflect a regional stress state shift or a statistical cluster at elevated baseline. We do not know whether Dona's parexism represents a one-time anomaly or the beginning of a period of more energetic behavior. We do not know whether the material from the May 8th eruption entered the stratosphere or remained in the troposphere. We do not know what changed in Dona's magmatic system to produce a 90-year anomaly in 16 minutes. These are not rhetorical unknowns offered to manufacture suspense. They are genuine open questions in geoysics and vulcanology that the relevant monitoring agencies and research institutions are actively working to answer. The concept of emergent behavior in complex systems is useful here. A complex system is one in which the interactions between components produce behaviors at the system level that cannot be predicted by examining the components individually.
The western Pacific subduction belt is a complex system by any definition. It involves dozens of tectonic plates and micro plates, hundreds of active volcanic systems, thousands of kilome of fault zones and interactions occurring on time scales from seconds to millions of years. The behavior of any individual component Dono Sakurajima the eastern Sama fault can be modeled and partially predicted using our understanding of that component in isolation. The behavior of the system as a whole, the correlated simultaneous activation of multiple components within a compressed time frame is harder to model and harder to predict because it depends on the interactions between components in ways that are not fully captured by any current geoysical model. This is not an excuse for ignorance. It is an honest description of the state of the science.
Our monitoring capabilities have improved dramatically over the past three decades. We have satellite based geodetic measurements that can detect millime scale ground deformation across entire subduction zones. We have seismic networks dense enough to locate earthquakes to within kilometers of their true hypo centers. We have volcanic gas sensors, thermal imaging, infrasound arrays, and ocean bottom seismometers that give us views of the subsurface that were unimaginable two generations ago. And yet on May 8th, 2026, a volcano with 90 years of well-monitored continuous activity produced a parexism that nobody predicted. That should be humbling. Not frightening in an irrational way, but genuinely humbling in the way that reminds us how much complexity remains in the system and how much of it is still beyond our ability to forecast.
The question of what this means for the near term is the one everyone wants answered and it is the one that deserves the most careful treatment of all. Part 17, three interpretations.
There are three ways to read what happened on May 8th, 2026 and the 10 days of activity that preceded it. Three interpretive frameworks. Each of them has evidence in its favor. Each of them has evidence against it. None of them can currently be proven or disproven with the data available. And the intellectually honest thing to do is to lay all three out clearly, assess their relative likelihoods as carefully as the evidence allows, and resist the urge to collapse the uncertainty into a full certainty in either direction. This is harder than it sounds. Human cognition is not well adapted to sitting with genuine ambiguity about phenomena that carry potential consequences at scale.
The temptation to pick a framework and commit to it to resolve the discomfort of not knowing is powerful and it has led researchers and commentators astray before. The discipline required is the discipline of the scientist who has learned through painful experience that premature certainty is more dangerous than sustained uncertainty. The first interpretation is coincidence.
Under this reading, the May 8th cluster is a statistical fluctuation in a high activity region. The western Pacific Arc is always producing events. The background rate of seismic and volcanic activity is elevated relative to most other regions on Earth. A consequence of the extraordinary tectonic geometry of the Pacific Rim where multiple oceanic plates are simultaneously subducting beneath the Asian and Australian continental margins generating the conditions for both persistent volcanism and frequent seismicity along thousands of kilometers of convergent boundary. In any given 10-day window in the Western Pacific, some number of events will occur. Occasionally more events than average will occur in the same window.
Not because they are related to each other, but because the background rate is high enough that clusters are expected as a matter of probability. A pasan process with a high mean rate will produce apparent clusters that feel significant to observers but carry no causal content. The dukono anomaly under this interpretation is a genuine internal variability event within the system. A rare but not impossible expression of Ducono's underlying volcanic potential triggered by some internal process, perhaps a fresh batch of more volatile rich magma reaching the upper conduit. Perhaps a transient structural change in the conduit geometry that has nothing to do with any other event in the region. Sakurajima's eruption on the same day is Sakurajima doing what Sakurajima does roughly nine times per year. And the fact that both events occurred on the same calendar day is a coincidence in the same way that any two events on a busy system can share a date. The shared date means nothing beyond the shared date. This interpretation is scientifically conservative. It does not require any novel mechanism. It does not demand that we posit communication between systems separated by hundreds or thousands of kilometers of lithosphere. It is consistent with the absence of demonstrated coupling between the events and it is the explanation that the majority of the vulcanological community would currently default to not out of complacency but out of a well- earned respect for the base rate of false pattern recognition in complex natural systems. Its weakness is that it does not account for the specific anomalousness of Ducono's behavior in the context of its long record. behavior that sits at the tail of its historical distribution in ways that are not easily dismissed or for the broader 10-day pattern that extends beyond just the 28th eruptions and encompasses a series of smaller but cumulatively notable events across the ark that preceded them. The second interpretation is regional stress state shift. Under this reading, the cluster reflects a real change in the mechanical state of the western Pacific lithosphere over the weeks or months preceding May 8th.
Multiple systems that were independently approaching their individual thresholds were pushed past those thresholds in a compressed time frame because the regional stress environment shifted. The individual events still have individual internal explanations. The magmatic processes that drove to Kono's paroxism, the pressure accumulation at Sakurajima's Minimdac crater, the fault slip that produced the eastern Samurm 6 event. But the timing compression reflects something real about the regional stress distribution, not just random variance. The stress pertubation could have originated from a variety of sources. A large but undetected slow slip event on one of the subduction interfaces, a transient change in plate convergence rates, a deep intraslab seismic event whose rupture propagated stress into the surrounding arc systems without producing a surface signature large enough to draw immediate attention.
This interpretation is more mechanistically challenging. It requires a regional scale stress redistribution event whose nature has not yet been identified, which means it is currently an explanation that accounts for the pattern by invoking a cause that has not itself been confirmed. That is a weakness that needs to be named plainly even as the framework remains intellectually coherent. It would predict weekly that the elevated activity is not yet over and that the coming weeks and months could produce further events in the same regional system. Not necessarily larger events, but further expressions of a stress environment that has not yet returned to its prior baseline. Its strength is that it provides a coherent framework for the entire 10-day pattern, not just the May 8th events in isolation. Its weakness again is the absence of a confirmed mechanism and the difficulty of distinguishing genuine regional coupling from the kind of post hawk pattern finding that the human mind performs automatically and unreliably on noisy data. The third interpretation is precursor phase to a larger event. This is the most disturbing of the three and the one that needs to be stated clearly while also being surrounded with the appropriate epistemic caveats. Stating it is not alarmism. refusing to state it would be a different kind of intellectual failure. The failure of a mission driven by the social discomfort of articulating a possibility that if wrong might appear to have caused unnecessary concern and if right would have been the most important thing to have said under this reading. The cluster of events we are seeing in the Western Pacific represents the early stages of a regional stress loading process that could culminate in one or more large- scale events. Whether that means a major volcanic eruption at one of the systems currently showing elevated activity, a large or great earthquake on one of the subduction interfaces in the region, or a combination of both. The historical record contains examples of elevated precursory seismic and volcanic activity preceding major events, sequences in which in retrospect the pattern was visible, even if it was not acted upon in real time. the 1783 Lackey and Asama events, the months preceding the 1960 Valdivia earthquake, the longerterm seismic pattern before the 2011 Tohoku event. The challenge is that the historical record also contains many more examples of elevated precursory activity that did not lead to major events. The ratio of false alarms to true precursors is high, dramatically, disconcertingly high. And the ability to distinguish between them in real time before the outcome is known is one of the most difficult problems in all of geoysics.
It may, with the data and methods currently available, be an intractable problem in the short term. Assigning relative probabilities to these three interpretations is genuinely difficult, and any specific numbers attached to them should be held loosely. If forced to an assessment based on the available evidence, most vulcanologists and seismologists would probably rank them in approximately the order in which they were presented. Coincidence most likely, regional stress state shift possible, and perhaps roughly equally plausible given the full 10-day picture, and the specific character of Dakono's anomaly, precursor phase to a larger event, the least likely of the three, but not negligible enough to dismiss without ongoing and intensive monitoring. The asymmetry of consequences matters here.
If coincidence is the right interpretation and we treat it as a stress state shift or a precursor sequence, the cost is heightened monitoring and perhaps some unnecessary public communication. If the precursor interpretation is correct and we treat it as coincidence, the cost is potentially measured in something else entirely. That asymmetry does not justify abandoning scientific standards of evidence, but it does justify maintaining a posture of active surveillance rather than passive observation.
What history tells us about this kind of situation is both instructive and sobering. It tells us that certainty in either direction has repeatedly proven to be the enemy of accurate assessment.
The scientists who were most wrong about major geological events were not always the ones who lacked data. They were sometimes the ones who had a framework they trusted too completely, who had stopped genuinely entertaining alternatives, who had in the language of the discipline committed to a model. The scientists who navigated ambiguous precursory periods most effectively were the ones who kept all three doors open, who updated continuously as new data arrived, and who resisted the social and institutional pressures that pushed toward premature resolution. That is the posture that the evidence currently demands. Three doors, all of them still open. Part 18, historical echoes.
There are three ways to read what happened on May 8th, 2026, and the 10 days of activity that preceded it. Three interpretive frameworks. Each of them has evidence in its favor. Each of them has evidence against it. None of them can currently be proven or disproven with the data available. And the intellectually honest thing to do is to lay all three out clearly, assess their relative likelihoods as carefully as the evidence allows, and resist the urge to collapse the uncertainty into a false certainty in either direction. This is harder than it sounds. Human cognition is not well adapted to sitting with genuine ambiguity about phenomena that carry potential consequences at scale.
The temptation to pick a framework and commit to it to resolve the discomfort of not knowing is powerful and it has led researchers and commentators astray before. The discipline required is the discipline of the scientist who has learned through painful experience that premature certainty is more dangerous than sustained uncertainty. It is also, it should be said, the discipline that funding agencies, government briefers, and news editors make exceptionally difficult to maintain. The institutional pressures that surround geological hazard assessment all push in the same direction toward a definitive statement, a clear recommendation, a number that can be put in a headline. The scientists who resist those pressures most successfully are the ones who have internalized at a level deeper than professional habit that the honest answer is sometimes a carefully constructed description of what is not yet known. The first interpretation is coincidence. Under this reading, the May 8th cluster is a statistical fluctuation in a high activity region. The Western Pacific Ark is always producing events.
The background rate of seismic and volcanic activity is elevated relative to most other regions on Earth. a consequence of the extraordinary tectonic geometry of the Pacific Rim where multiple oceanic plates are simultaneously subducting beneath the Asian and Australian continental margins generating the conditions for both persistent vulcanism and frequent seismicity along thousands of kilometers of convergent boundary.
In any given 10-day window in the Western Pacific, some number of events will occur. Occasionally more events than average will occur in the same window. Not because they are related to each other, but because the background rate is high enough that clusters are expected as a matter of probability. A poson process with a high mean rate will produce apparent clusters that feel significant to observers but carry no causal content. The human pattern recognition apparatus tuned by evolution to find signal in noise will interpret those clusters as meaningful regardless of whether they are. This is not a failure of intelligence. It is the operation of a cognitive system that was built for an environment where the cost of a false positive detecting a predator that was not there was much lower than the cost of a false negative. That asymmetry appropriate for ancestral environments becomes a liability in the context of geoysical interpretation where the false positive has its own costs and the signal to noise ratio in the data is genuinely low. The Dono anomaly under the coincidence interpretation is a genuine internal variability event within the system. A rare but not impossible expression of Dono's underlying volcanic potential triggered by some internal process.
Perhaps a fresh batch of more volatile rich magma reaching the upper conduit.
Perhaps a transient structural change in the conduit geometry that has nothing to do with any other event in the region.
Sakurajima's eruption on the same day is Sakurajima doing what Sakurajima does roughly nine times per year. And the fact that both events occurred on the same calendar day is a coincidence in the same way that any two events on a busy system can share a date. The shared date means nothing beyond the shared date. This interpretation is scientifically conservative. It does not require any novel mechanism. It does not demand that we posit communication between systems separated by hundreds or thousands of kilometers of lithosphere.
It is consistent with the absence of demonstrated coupling between the events. And it is the explanation that the majority of the vulcanological community would currently default to, not out of complacency, but out of a well- earned respect for the base rate of false pattern recognition in complex natural systems. Its weakness is that it does not account for the specific anomalousness of Ducono's behavior in the context of its long record. Behavior that sits at the tail of its historical distribution in ways that are not easily dismissed or for the broader 10-day pattern that extends beyond just the two May 8th eruptions and encompasses a series of smaller but cumulatively notable events across the ark that preceded them. The coincidence interpretation can accommodate any individual event. Its discomfort lies in accommodating all of them simultaneously at the same level of analytical charity.
The second interpretation is regional stress state shift. Under this reading, the cluster reflects a real change in the mechanical state of the western Pacific lithosphere over the weeks or months preceding May 8th. Multiple systems that were independently approaching their individual thresholds were pushed past those thresholds in a compressed time frame because the regional stress environment shifted. The individual events still have individual internal explanations. The magmatic processes that drove Dona's parexism, the pressure accumulation at Sakurajima's Minamadaka crater, the fault slip that produced the eastern Sama M6 event, but the timing compression reflects something real about the regional stress distribution, not just random variance. The stress perturbation could have originated from a variety of sources. A large but undetected slow slip event on one of the subduction interfaces. A transient change in plate convergence rates. A deep intraslab seismic event whose rupture propagated stress into the surrounding arc systems without producing a surface signature large enough to draw immediate attention. Slow slip events in particular have become an increasingly recognized feature of subduction zone dynamics over the past two decades. As instrumentation capable of detecting them has become more widely deployed. They can transfer stress across surprisingly large distances without producing the kind of surface level seismicity that would otherwise draw attention and their relationship to both volcanic unrest and triggered seismicity on adjacent fault systems is an area of active and not fully resolved research. This interpretation is more mechanistically challenging than coincidence, but it is not mechanistically implausible. The relevant physics exist. The question is whether they operated in this specific case and the answer to that question requires data continuous GPS time series borehole strain meter records repeating earthquake cataloges that have not yet been fully analyzed for the relevant window. The interpretation requires a regional scale stress redistribution event whose nature has not yet been identified which means it is currently an explanation that accounts for the pattern by invoking a cause that has not itself been confirmed. That is a weakness that needs to be named plainly even as the framework remains intellectually coherent. It would predict weakly that the elevated activity is not yet over and that the coming weeks and months could produce further events in the same regional system, not necessarily larger events, but further expressions of a stress environment that has not yet returned to its prior baseline. Its strength is that it provides a coherent framework for the entire 10-day pattern. Its weakness again is the absence of a confirmed mechanism and the difficulty of distinguishing genuine regional coupling from the kind of post hawk pattern finding that the human mind performs automatically and unreliably on noisy data. The third interpretation is precursor phase to a larger event. This is the most disturbing of the three and the one that needs to be stated clearly while also being surrounded with the appropriate epistemic caveats. Stating it is not alarmism. Refusing to state it would be a different kind of intellectual failure. The failure of a mission driven by the social discomfort of articulating a possibility that if wrong might appear to have caused unnecessary concern and if right would have been the most important thing to have said under this reading. The cluster of events we are seeing in the Western Pacific represents the early stages of a regional stress loading process that could culminate in one or more large scale events. Whether that means a major volcanic eruption at one of the systems currently showing elevated activity, a large or great earthquake on one of the subduction interfaces in the region, or a combination of both. The historical record contains examples of elevated precursor seismic and volcanic activity preceding major events. The challenge is that the historical record also contains many more examples of elevated precursor activity that did not lead to major events. The ratio of false alarms to true precursors is high, dramatically, disconcertingly high. And the ability to distinguish between them in real time is one of the most difficult problems in all of geoysics. It is a problem that has consumed careers, generated substantial and unresolved methodological debate and produced a literature whose honest bottom line is that the state-of-the-art is considerably less powerful than the public and some policymakers believe it to be. Assigning relative probabilities to these three interpretations is genuinely difficult and any specific numbers attached to them should be held loosely. If forced to an assessment based on the available evidence, most vulcanologists and seismologists would probably rank them in approximately the order in which they were presented.
Coincidence most likely regional stress state shift possible and perhaps roughly equally plausible given the full 10-day picture precursor phase to a larger event the least likely of the three but not negligible enough to dismiss without ongoing monitoring. The asymmetry of consequences matters here. If coincidence is the right interpretation and we treat it as a stress state shift or a precursor sequence, the cost is heightened monitoring and perhaps some unnecessary public communication. If the precursor interpretation is correct and we treat it as coincidence, the cost is potentially measured in something else entirely. That asymmetry does not justify abandoning scientific standards of evidence. It does not justify treating low probability interpretations as though they were high probability ones because that path leads to a monitoring and communication environment in which elevated alerts lose their meaning through overuse and the population that needs to respond to them stops doing so. Credibility is a resource that depletes and does not easily replenish and the institutions responsible for hazard communication in the western Pacific have a long memory for the consequences of its mismanagement.
The history of major volcanic and seismic events in the western Pacific is not short and it does not lack for cases where elevated precursor activity was in retrospect a signal of something larger approaching. But it also does not lack for cases where similar patterns of elevated activity resolved without a major climactic event. Leaving monitors to conclude, sometimes years later, that the system had been close to a threshold but pulled back, had accumulated enough energy to approach a critical transition without quite reaching it before internal processes bled off the excess stress through a series of smaller releases insufficient to register in the public memory of geological disaster.
The asymmetry in how these two kinds of outcomes are remembered is itself a source of bias. The events that culminated in major eruptions or earthquakes are remembered because they produced consequences large enough to anchor them in institutional and collective memory. The near misses, the periods of elevated activity that quietly subsided are remembered mainly by the monitoring agencies that documented them and imperfectly even there. This asymmetry means that the historical record as it is typically invoked in hazard discussions systematically overrepresents the cases where elevated precursor activity led somewhere dramatic which inflates intuitive estimates of the probability that any given episode of elevated activity will do the same. The 1991 eruption of Pinatubo in the Philippines is the paradigmatic example of a volcanic event that was preceded by precursory signals sufficient to allow one of the most successful evacuation efforts in volcanic history. Pinatubo had been dormant for approximately 500 years before its reawakening. In the months preceding the June 1991 eruption, it produced a remarkable sequence of precursors. an initial magnitude 5.1 earthquake in April followed by increasing seismicity, ground deformation, and eventually a series of friatic explosions as the ascending magma encountered groundwater. The precursory sequence was recognized. The Clark Air Base and surrounding communities were evacuated and thousands of lives were saved. The eruption itself, when it came, was the second largest of the 20th century.
The success of the Pinatubo response has since become the benchmark against which volcanic monitoring and emergency management are measured. A case study repeated in classrooms and government briefings across the Pacific basin. It represents something genuinely important. The demonstration that vulcanological science applied with appropriate urgency and translated into effective emergency management can reduce catastrophic loss of life even in the face of events at the upper end of the historical magnitude distribution.
But the Pinatubo example for all its instructiveness has an important structural difference from the May 2026 situation. Pinatubo was a single system precursory sequence. The precursors were all coming from the same volcano building toward the same event tightening around the same locus of magmatic activity with a clarity that while not always obvious in real time became unmistakable as the sequence developed. The scientific and emergency management apparatus could orient itself toward a specific target, concentrate its instruments and its attention, and make probabilistic statements about a defined system with increasingly well- constrained parameters.
The decision space was difficult, but bounded. The question was not which of many systems to watch, but how seriously to wait the evidence accumulating at a single identified source and when to escalate the response. What we're examining in May 2026 is a multi-system pattern with elevated activity distributed across multiple volcanoes and seismic sources spanning thousands of kilome of ark. There is no direct analog in the historical record for this kind of distributed multi-system pattern as a precursor to a single large event because a single large event does not typically have precursors distributed across the entire arc in which it sits.
Precursors are generally local to the system where the event will occur. The distributed nature of the current pattern is depending on your interpretive framework either evidence against the precursor hypothesis or evidence that whatever is driving the activity is itself distributed a regional rather than local phenomenon operating at a scale that individual monitoring networks were not designed to detect.
The monitoring infrastructure of the western Pacific Ark for all its genuine sophistication was built around the model of system specific surveillance instrumentation deployed at or near identified high-risisk volcanoes and fault segments oriented toward detecting the buildup of hazard at known sources.
It is less well configured to detect and characterize the kind of regional scale stress redistribution that the second and third interpretations require. What the historical record does show is periods of regionally elevated activity that persisted for months to years without a single culminating catastrophe with elevated energy being released gradually across multiple smaller events rather than concentrated in one large one. The 1993 to 1997 period of elevated volcanic and seismic activity across the Philippines and Indonesia included multiple significant eruptions and episodes of elevated seismicity without producing a pinatubo scale climax. The region was restless. Individual systems flared. Communities near active volcanoes lived for extended periods under elevated alert levels with all the economic and psychological costs that sustained watchfulness imposes. And then without a dramatic resolution, the regional tempo gradually quieted.
Whether the accumulated stress was genuinely dissipated through the series of smaller events or whether it was merely redistributed into configurations that monitoring systems could not track remains a question without a clean answer. The historical record ends. The geological process does not. An earlier and less frequently cited parallel is the period of elevated seismic and volcanic activity that preceded and followed the 1976 Mororrow Gulf earthquake in the southern Philippines.
A magnitude 8 event that generated a tsunami killing several thousand people and that was preceded by months of unusual seismic activity distributed across multiple fault systems in the region. In retrospect, the distributed pattern of the precursory seismicity looked different from what monitoring agencies had been expecting, which contributed to the degree of surprise when the main event occurred. The Morogulf event is instructive not because it confirms the precursor interpretation for May 2026, but because it illustrates that distributed multi-system precursory patterns are not without precedent in the Western Pacific, even if they are less frequently invoked than the cleaner single system sequences. This is honestly the most likely trajectory for the current situation as well. Not a dramatic culminating catastrophe, not a clean resolution to quiet, but a continued period of elevated activity, variable and distributed, expressing itself through a series of moderate to significant events across multiple systems over weeks to months before the regional stress state, whether elevated or not, settles into a new baseline. a prolonged chapter of watchfulness rather than a single decisive event that resolves the ambiguity in one direction or the other. History suggests that geological ambiguity rarely resolves cleanly. It tends to fade slowly into a new normal that is neither the disaster that was feared nor the complete quiet that was hoped for. The monitoring agencies issue updated bulletins. The alert levels are incrementally revised upward and downward at individual systems as local data accumulates. The public attention, which was briefly and intensely concentrated on May 8th, diffuses back into the general background noise of a region that is always at some level in a state of geological watchfulness. That trajectory is still worth watching carefully because even without a single catastrophic culminating event, a prolonged period of elevated multi-system activity in the Western Pacific has real consequences for the people who live along it. Aviation corridors across the Ark remain vulnerable to ash disruption from any of a dozen active systems, and the economic and logistical consequences of sustained flight path alterations and airport closures in a region as air traffic dense as the Western Pacific are not trivial. Coastal communities throughout the Philippine archipelago, Eastern Indonesia, and southern Japan sit within tsunami inundation zones for subduction interface events that do not require extraordinary magnitudes to be locally devastating. A magnitude 7 to 7.5 event on a shallow wellpositioned fault segment can generate locally significant tsunami runup without registering as a global catastrophe in the media or the scientific literature. Agricultural systems across volcanic regions already operating under long-term stress from prior eruptions have limited additional capacity to absorb the disruption that even moderate renewed activity can produce. Ash fall on a growing season already compromised by prior volcanic influence. Laarea flows reactivating drainage systems that communities had cautiously resettled. The incremental loss of arable land that does not accumulate to a headline but accumulates to a food security problem. And the cumulative psychological and economic burden of sustained elevated alert levels. The kind of prolonged watchfulness that the distributed pattern suggests may be ahead is itself a form of harm that does not appear in the seismic record but is no less real for that. Alert fatigue is real. Its consequences in terms of reduced compliance with evacuation orders when they eventually come are also real and they have been documented in volcanic communities across the ark that have spent years living adjacent to elevated alert zones. There is also the question of institutional capacity.
The monitoring agencies of the Western Pacific, Fivolks in the Philippines, the Indonesian Center for Volcanology and Geological Hazard Mitigation, the Japan Meteorological Agency's Volcanic Monitoring Division, and the numerous national seismic networks across the region are staffed by scientists of genuine competence and dedication operating under chronic resource constraints.
A prolonged period of elevated multi-system activity taxes those resources in ways that single system events do not. Maintaining heightened surveillance across many systems simultaneously, communicating with multiple national emergency management bureaucracies, managing the public communication demands of sustained elevated alerts at multiple locations.
All of this strains organizations that were not necessarily designed or funded for distributed regional crisis. The scientific and operational response to a period like the one potentially ahead would benefit from the kind of coordinated multinational resource sharing that is easier to describe than to execute and that the region has historically found difficult to sustain.
There are a lot of people who live along the western Pacific Ark. The combined population of the coastal and near coastal communities within meaningful hazard range of the systems currently showing elevated activity numbers in the tens of millions. And the infrastructure, ports, power generation facilities, transportation networks, urban centers concentrated in these zones represents an enormous proportion of the economic activity of some of the most dynamic economies in the world.
They deserve monitoring that is honest about what it does and does not know.
They deserve communication that neither amplifies uncertainty into panic nor suppresses it into false reassurance that treats them in other words as adults capable of incorporating probabilistic information into their own decision-m rather than as a population to be managed through selective disclosure.
They deserve the kind of sustained institutional attention that outlasts the news cycle that the May 8th events briefly generated and that does not require a catastrophe to maintain its funding and its political salience.
Whether the interpretation that ultimately proves correct is coincidence, regional stress state shift, or something more consequential, that obligation does not change. The people in the hazard zones do not get to wait for the correct interpretation to be confirmed before making decisions about their lives, their businesses, their crops, their children's schools.
They are already living with the uncertainty whether or not it is being clearly communicated to them. The least that science and its institutional vehicles can do is ensure that the uncertainty is communicated clearly, honestly, and with sufficient context to be actionable rather than merely alarming. Three doors remain open. The work of watching continues and the most important thing that can be said about the situation in the Western Pacific as of May 8th, 2026 is not which door is most likely to contain the answer, but that all three are still open. That the data needed to close any of them decisively has not yet arrived, and that the appropriate response to that condition is not to pick one and stop looking. It is to watch all three simultaneously with the instruments and the analytical patience that the question deserves and to be honest in every public and institutional communication that follows about exactly how much and how little is currently known.
Part 19, the monitoring phase.
We are now in a monitoring phase for the Western Pacific Ark. That phrase has a specific meaning. It means that the events of May 8th and the 10-day cluster that preceded them have raised the baseline level of attention being paid to this system by the international vulcanological and seismological community. It means that data that would normally be processed in routine review cycles is being examined more frequently and with greater scrutiny. It means that certain thresholds for issuing public warnings and elevating alert levels have been mentally lowered. Not because the science has changed, but because the recent pattern has provided new context for interpreting signals. For Ducono, the most important monitoring question is whether the May 8th parexism was an isolated event or the first in a series.
The indicators to watch are seismic tremor patterns beneath the volcano, ground deformation data from INSAR satellite measurements, and any GPS networks in the vicinity, volcanic gas emission rates, particularly SO2, and whether subsequent eruptions show any trend toward greater energy release rather than returning to the premay 8th baseline. As of available reporting, Dakono has returned to its characteristic continuous low-level activity following the May 8th event.
But the question of whether the magmatic system has fundamentally changed state or whether the peroxism was a transient excursion cannot yet be answered confidently. For Sakurajima, the monitoring question is about eruption frequency and escalation. Its ninth eruption of 2026 in early May against the context of the regional pattern warrants closer attention to whether the annual eruption count accelerates in the coming months and whether individual events show increasing energy, increasing ballistic range or structural changes in the eruption style that might indicate deeper magmatic involvement.
The Japan Meteorological Agency maintains one of the most sophisticated volcanic monitoring networks in the world around Sakurajima given its proximity to Kagoshima. And that network will provide early warning if the system begins to escalate towards something more serious.
For the Philippine Ark, the four volcanic systems at elevated alert status represent perhaps the most consequential near-term monitoring priority in the region simply because of the population density and the historical pattern of rapid escalation in Philippine volcanic activity. Mayan with its history of pyrolastic flows extending to populated areas is the most immediately hazardous. Tal Bulusan and Canleon each at their own elevated alert states round out a picture of an arcwide system under stress.
For the Papua New Guinea swarm recorded on May 8th, seismologists will be monitoring whether the swarm resolves, intensifies, or migrates along the fault structure as the direction of migration can provide information about whether fluid movement or magmatic intrusion is responsible for the seismicity. The global monitoring architecture for this kind of distributed multi-system observation is more capable than it has ever been and significantly more capable than it was during previous regional activity episodes in the Western Pacific. VAC, the volcanic ash advisory centers, provide continuous satellite-based monitoring of ash emissions from all active volcanoes globally. the USGS, the Japan Meteorological Agency, PVMBBG in Indonesia, FIVO LCS in the Philippines, the Rabul Volcanological Observatory in Papua New Guinea, and multiple international seismic networks all contribute data that is in many cases publicly accessible in near real time.
The collective intelligence of this monitoring network is substantial, but there are gaps. Ducono's remote location on Halmah means that its groundbased monitoring infrastructure is less dense than it would be for a volcano in a more accessible location. The deep ocean floor between these arc segments is instrumentally sparse. And the interpretation of distributed multi-system patterns in real time as opposed to in retrospect remains one of the hardest problems in geoysics precisely because the patterns only become unambiguous at scales of time that make them useful for historical understanding but less useful for immediate hazard assessment.
What to watch for in the coming days and weeks is a short list. any recurrence of Dakono scale paroxisms from Dono itself any escalation in Sakurajima's eruption frequency or explosion energy any increase in alert levels on the Philippine volcanic systems any large magnitude seismic events on the Philippine sea plate interface and any reports of anomalous ground deformation or gas emissions from any of the monitored systems in the region. This is not a prediction that any of those things will occur. It is a description of the signal space we should be watching given the pattern that May 8th has established.
Part 20. Final frame.
Let's go back to 7:41 in the morning over Hal Mahira. The sun is just clearing the horizon. The light is pale gold and the sea around the island is still the way the sea is still in the very early morning before the wind picks up. And then a mountain that has been smoldering continuously for 93 years does something it has not done in living memory. It sends a column of ash so high and so fast that it reaches the boundary between the part of the atmosphere where things are washed out in days and the part where they persist for years. In 16 minutes, three people die. Others scramble for safety in the dark cloud that descends on the mountains flanks. 7 hours and 34 minutes later, the sun is low in the west over Kyushu, and Sakurajima does what Sakurajima does.
But it does it on this specific day against this specific backdrop. And the combination of both events in a single calendar day across the same tectonic arc cannot be entirely dismissed as noise. The Western Pacific on May 8th, 2026 presented the scientific community and the public with a moment of genuine ambiguity. Not the manufactured ambiguity of conspiracy theories and fringe explanations. Not the false ambiguity of inadequate information.
Genuine ambiguity. Multiple competing explanations, each consistent with the available data. Each with different implications for what comes next. None of them yet distinguishable from the others by the evidence currently in hand. The anomalies are real. Dono's order of magnitude deviation from its 90-year baseline is real. The 10-day cluster across multiple systems on the same arc is real. The tropopause proximity of the Ducano plume is real.
The simultaneous elevated alert status of multiple Philippine volcanic systems is real. None of these are manufactured urgency or statistical slight of hand.
They are the data presented as clearly as the data permits. What those real anomalies add up to is the open question. And the honest answer, the one that serves you better than a false certainty in either direction is that we do not yet know. We are watching. We are monitoring. We are running models and rerunning them with May 8th incorporated as a new data point. And we will keep watching because the system is not going to issue a press release when it decides what it is doing. What we can say with confidence is this. The Western Pacific subduction belt is one of the most complex, energetic, and consequential tectonic systems on the planet. Hundreds of millions of people live within reach of its volcanoes and fault zones. The events of May 8th remind us, not for the first time, and certainly not for the last, that this system has the capacity to behave in ways that exceed our models and our expectations.
The fact that Ducono can produce a 90-year anomaly in 16 minutes without clear precursory warning is not a comfortable thing to know. The fact that it happened on the same day that Sakurajima fired its ninth shot of the year is not a comfortable juxtiposition.
The fact that both events sit inside a 10-day regional cluster is not a comfortable context. But comfort has never been what this kind of monitoring is about. It is about understanding. An understanding in this case begins with the honest admission that the data has exceeded our explanations and that the gap between what we know and what we need to know is where the important work now lives. The individual systems here are understood. Dakono is mapped, monitored, cataloged. Sakurajima is one of the most studied volcanoes on Earth.
The Philippine Ark has been the subject of continuous volcanological research for decades. We know these systems individually in remarkable detail. The collective pattern, the simultaneous expression of multiple systems along the same arc in the same compressed window is where our understanding runs thin.
And that is the genuinely unsettling realization that May 8th, 2026 has handed us. There is a concept in complex system science called synchronization.
It describes the phenomenon whereby independent oscillating systems, each operating according to its own internal dynamics begin to coordinate their behavior through some form of weak coupling. The classic example is metronomes on a shared surface. Started at random phases, they eventually synchronize, not because any individual metronome changes its fundamental behavior, but because the shared platform allows a tiny feedback between them that gradually aligns their rhythms. Synchronization does not require direct communication between the components. It requires only that they share a medium through which some small influence can pass. The Earth's lithosphere is a medium. It transmits stress. It transmits seismic energy. It transmits slowly and imperfectly the mechanical state of one segment to another. Whether the events of May 8th represent a version of geological synchronization, multiple systems aligned by weak coupling through the shared lithospheric medium is a question that cannot currently be answered. The geoysical community does not have consensus on whether lithospheric coupling can operate at the spatial scales required to produce a pattern like the one we're observing. But the question has been asked by the data itself. There is a detail from May 8th that keeps returning. The three climbers who did not come down from Dono, they were on a mountain that had been erupting in its low-key way for their entire lives and for the lives of their parents and grandparents. The mountain was always active. That was its identity. The background noise of its existence was so consistent, so familiar, so woven into the landscape and the risk calculus of everyone who approached it that the category of significant eruption had perhaps faded from immediate concern. And then in 16 minutes, the category reasserted itself with finality. The Western Pacific Ark is always active. That is its identity.
The background noise of its existence is higher than almost anywhere else on Earth. And the events of May 8th are asking without yet answering whether the familiar background noise has begun to change pitch. Not louder yet necessarily, but different. synchronized in a way that the instruments are picking up and the models are not yet fully explaining. The synchronization of metronomes begins slowly, almost imperceptibly before it locks. You watch individual metronomes and they look like they are doing their own thing. And then if you step back and watch the group, you notice that the individual things they are doing have begun subtly and without announcement to line up. The Western Pacific isn't quiet. It's synchronizing. And whether that synchronization is the beginning of something or the continuation of something already in progress, whether it will resolve into a single catastrophic expression or distribute its energy across a hundred smaller events over the coming months, whether it represents a statistical fluctuation we will look back on as nothing, or a regional stress event we will look back on as the prologue to something larger, no one on Earth can tell you with certainty right now. What can be told with certainty is this. On May of 8th, 2026, two of the oldest and most persistently active volcanic systems on the Western Pacific Ark exceeded their expected behavior within the same day within the same tectonic framework against the backdrop of a 10-day sequence of events that spans 3,000 km of the same system.
The altitude Dakona reached is real. The energy Sakurajima released is real. The cluster that preceded them is real. The interpretation of all of that remains open and open questions in geology as in life have a way of closing themselves in the language of events rather than the language of conclusions. We are watching and the watching is not over.
Videos Relacionados

Is dark matter real? - Why can't we find it? - physicist explains | Don Lincoln and Lex Fridman
LexClips
1K views•2026-05-30
Nobody Expected This Lava Reaction 🤯 #faits #facts
TendzDora
28K views•2026-05-30
Saptarshi Basu - Spectacular Voyage of Droplets: A Multiscale Journey to Extreme Flow Conditions
DAlembert-SU-CNRS
152 views•2026-06-02
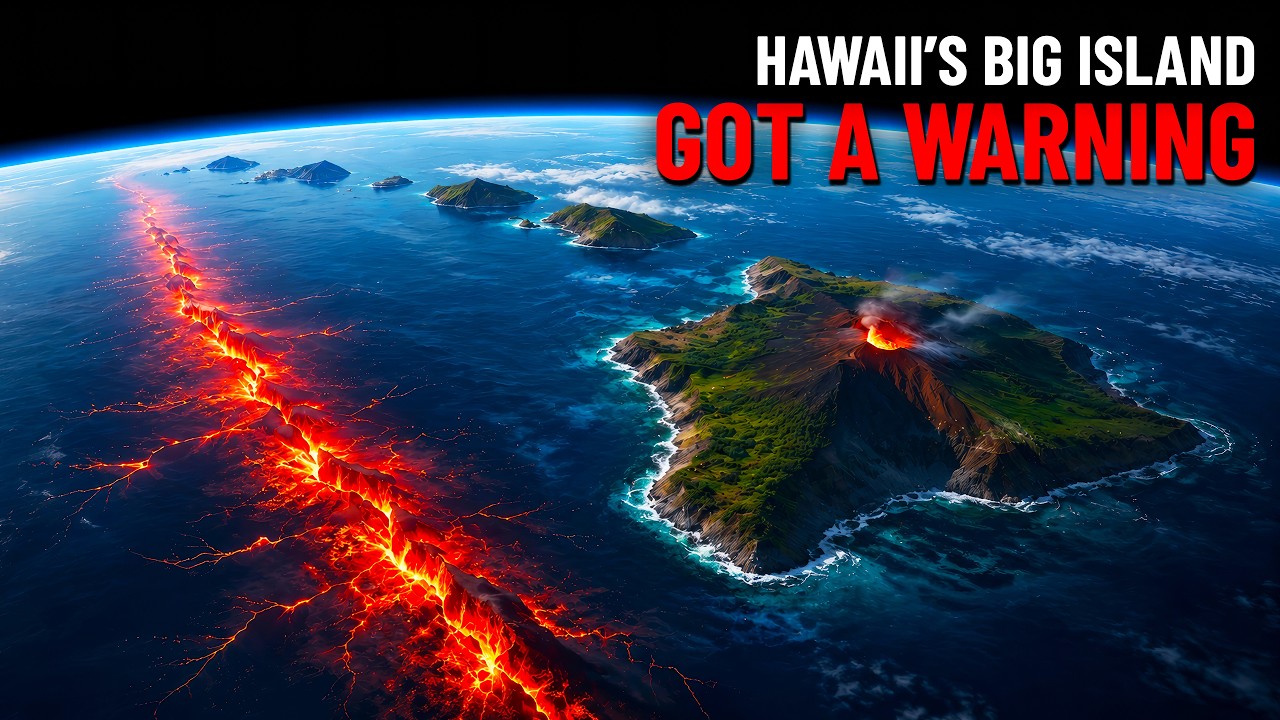
A 6.0 Just Hit Hawaii — And It Came From The Wrong Place
TerraWatchHQ
115 views•2026-06-03

The Split-Second Mistake That Made Bouncing Bettys So Deadly
NoMansLandChannel
253 views•2026-06-02

The Silent Memory of Glass
UnchartedScienceworld
146 views•2026-05-30

The Difference In Charged And Neutral Particles
heavybrainspace
959 views•2026-05-29

A380 vs Every Vehicles Crash Test Challenge | Which One Win?
BeamLap
163 views•2026-05-29


