Professor O'Quigley’s analysis is a chilling demonstration of how statistical illiteracy in the courtroom can transform random patterns into a false narrative of guilt. It serves as a necessary reminder that justice must be grounded in rigorous mathematical truth rather than persuasive but flawed data visualization.
Install our extension to search inside any video instantly.
Lucy Letby - Professor John Q'Quigley, Statistician - 19 nurses conference
Added:[applause] >> Day one. Day one of the trial, 12:52 p.m.
Manchester Crown Court. The statistics of the mortality rate were comparable prior to January 2015.
There was a significant rise. The babies had died unexpectedly.
They defy the expectations of the treating doctors. So, all of this was said right from day one. Expectation is a statistical quantity. Actually, what do you mean by expectation? They mean numbers. They were seeing more than that. How many more were they seeing?
All of this is statistics, all of it.
So, the interesting thing is this is right from the outset, which obviously contrasts to some extent with what was said later on when the arguments were made that this has got nothing to do with statistics.
It was actually nothing to do with anything other than statistics as far as Lucy Letby was concerned, because whatever the evidence regarding uh insulin, embolism, overfeeding, dislodging tubes, whatever these, nobody saw anything. So, there's nothing there pointing the finger at Lucy Letby.
Zero. Absolutely zero. So, it's interesting to discuss all of that, of course, and in in in a bid to prove innocence, which is something of a quite near impossible task.
Um all of that comes to bear. But but in as far as the prosecution is concerned, their case hinges on just one thing, statistics. So, we're going to go and look at that. I'm going to try and make it as interesting as I can. I understand a lot of people are not quite as passionate about statistics as Did I hear it? No. Okay.
Um they should be. It's a fascinating subject. It really is, believe me. And anyway, for those who who may not feel the same way, the reassuring thing I have to say to you is there is just one slide that has a mathematical formula on it. Had to include it because there are I'm certain there will be some statisticians out there and I I do need to describe that, but that's just one. So, if you can bear with me, we'll go through the statistics.
More statistics.
So, that was one of the first things.
This is statistically significant spike in the rate of deaths. This was Ravi Jayaram consulted. Now, many of us who've done any kind of basic introductory statistics will know that this is a highly technical term, statistically significant. That's highly technical. It means something very specific. Now, Ravi Jayaram, either he knew what he was talking about or he didn't. Now, if he didn't know what he was talking about, which is of course a possibility, then he needs to Yeah, well, then he needs to be asked, "Why are you using that expression?"
On the other hand, if he says he does know what it means, then again, why are you using something inappropriately?
Because there was never any study done that showed that there was a statistically significant spike.
That in itself, by the way, is a fascinating study to try and look at the rates or there's an increasing rates. Of course, year in, year out, the years the rate may go down at one center, go up somewhere else. We have an average, we know what we're dealing with, and but the average is not coming if it's two and a half, that's impossible. It will be two one year, three the next. It varies a little bit. So, how far does it vary before we start saying, "Well, listen, that's beyond what seems a reasonable thing to anticipate." That's what we might describe as a spike.
So, uh another very statistical thing.
Whenever there's a problem, the nurse is always there. This has always been claimed. There's absolutely no basis at all for that claim, but it's uh and and we will look at this precisely using statistical methods.
It's just not true, but it was made pulled out of the air.
Again, highly statistical assertion here um that there is a potential link to the nurse. Well, what would that link be, you know? Let's let's check that. Of course, with the subjective interpretation of behavior and the common denominator in many unexplained deaths. Once again, this is a at least arithmetic um but more likely statistics. Where did these things come from?
And I think I'm quoting I may be wrong here, but I believe I'm quoting a Judith Moritz in the Was it in the BBC? So, in the probability of being present is vanishingly small.
Where did she get that from?
And what do you mean by vanishingly small? What is do you mean by by small?
These things need to be quantified and they can be quantified. And that's that's why you should get interested and excited by statistics because believe me, it is a fascinating subject.
And then of course, when she was taken off the unit, the death rate drops dramatically. Now, this comes into the whole area of causal inference, which is an important field actually in statistics.
Um but what can we attribute that to? The fact that the unit itself was reclassified uh may explain quite a lot.
Okay.
To back all of that up, to back the whole story up, we have what is known as the roster chart evidence that I think I can now describe it as the famous roster chart evidence because I don't know how many times we've seen it. And of course, we have seen it in other cases, um Lucia de Berk. I think in many, many, many of these other cases, uh Beverly Allitt, we saw the exact the exact same chart. It's identical. So, where did this chart come from? What is it? And of course, when you first see the chart as I did, as all of us do, when you first see the chart, you think, "Wow, something stands out. Something really does stand out there." I think.
And let's look at what they made of it.
What did the prosecution make of this?
Nick Johnson claimed the chart was self-evident. In other words, that chart would done. Well, he's right in in a sense. That was all of their case. He might as well have just gone home at that point. Says, "Our case is this chart." And it was. There was nothing else pointing at Lucy Letby, just this chart.
As far as he's concerned, it's self-evident. And of course, the jurors were told that um there there was something odd going on in the in the the ward, the unit, and there were unexplained collapses and deaths. Now, if you accept that, and they did manage to convince them that that was the case, once you've accepted that, well, then the chart tells you exactly who the culprit is. That was the argument all the time.
And so, and he said this, yes, if the jury conclude that children were attacked, then the shift pattern gives the answer as to who the attacker was.
So, once again, absolutely underlining the fact that the only evidence pointing at nurse Letby is this chart.
The BBC again, the roster was a key part of the case, a striking visual symbol of the case against her. It's actually a striking visual symbol of nothing at all. Now, they got it somebody quoted me the other day, but I did say the thing it does show is that when she was on duty, she was on duty.
It doesn't show anything else. That's how they get that chart.
And and then we had these odd statements. The Farewell inquiry, we're told that she was 80% more likely to be on duty when babies collapse at the hospital.
Where did that come from? I don't know who said that, but it's obviously pulled out of thin air. It doesn't correspond to anything that was done or calculated.
Um and then even more Well, I'm surprised at such a level-headed person making a statement like that.
Well, he said that the probability of death increased by a factor of 30. That is wild. Where did that come from? I mean, where did it come from? It's a phenomenal figure. And I think Peter Elston got that figure. He told me it's a crazy calculation. I don't remember what it was, but anyway, pretty wild. So, all of these things are rather wild.
And all of that can be condensed into two central arguments of the prosecution.
When bad things happen, death or collapses, Nurse Letby is always there.
That's what they were saying. That was their case.
And the other thing which is interesting, you switch it on its head.
When she was there, then bad things happened.
In probability, people often get confused. These are interesting angles, you know, if I say I I throw a die and I say to you, what is the probability of getting a five?
But I'm going to tell you I get an odd number.
Well, it's easier to work out. It's one over three. There's only three possibilities, one, three, and five.
It's one over three.
But if I say to you, I got a five, what is the probability I got an odd number?
Well, it's 100%. Five's an odd number.
Well, you might say that's so obvious, and it is so obvious, and it comes up all the time. Conditional probability, getting it the wrong way around. But believe me, people do this all the time.
They're always getting it the wrong way around. And the um Nick Johnson even said as much here.
He had no evidence at all. He has the chart. If we're going to accept the chart as worth anything, it does suggest that when something there was an a suspicious event on the left, then no Letby was present. As she was in all those crosses. But there's no information there to say when she was present, there was more likelihood of seeing a suspicious event. So those things have been switched around and um and of course there's no evidence for the second one. Turns out there's none for the first either. But we'll get onto that in a second. So the question is is any of this true? Um is any of this true?
It's all coming from the chart. All of it. E- everything that's convincing. I think the rest, you know, well it's technical issues, but in any event, even if there were problems with insulin or embolism, whatever it might have been, there's nothing pointing in the direction of Lucy Letby. This points in the direction of Lucy Letby and it's the only thing pointing in the direction of Lucy Letby. So let's ask the following question. What did the jury see?
Well, I think they saw that. I think we saw that, too. Actually.
In fact, I'll go up one step further.
I think everyone in this room saw that.
The rest is just I don't know what it is. It's something else. You know? But this I can see. This is what matters.
This is what they took home. This means event one down to 25, probability of nurse 23 was actually nurse Lucy Letby.
Probability of being present, boom boom boom, 100%. That's what everybody's seeing.
But in fact that is not what we should be seeing. We should be looking at this instead. Nurse 23 has now been removed from the analysis entirely.
And you might say, "Well, what What I do with that?" Well, believe me, you can do an awful lot with that. This tells us all we need to know.
Because what it tells me is the presence of the non-accused nurses, those nurses who nobody's accusing of doing anything.
So, we have their presence. We have the distribution what we call the statistical distribution of presence for these nurses. Some were there only once, some were there twice, three times, four times, many times. Doesn't matter. We have that distribution. So, all we need now to find the distribution of presence for nurse Lucy Letby is to First, we need those There were a total of 61 events. We need to bring into play the 36 non-suspicious events that were discussed in conjunction with the 25 suspicious events, although we do not have the information I'm giving here because we didn't have all of that information. We were just told there were 36 non-suspicious events which were reviewed by the team going over all of this, including of course our good friend um Dr. Evans.
Now, how did I find this? Well, this is very simple and very basic in statistics. And another reason you might want to get interested, you can do a lot of fun things. And one thing you can do is simulate. Simulate means I replicate something under some basic assumptions.
Now, the basic assumptions I have here are that uh any nurse I have them from 1 to 30 uh all of them actually that were that were looked at 38. For anyone not accused, I will make this statistical assumption of independence. So, in other words, whether an event deemed suspicious occurred on that shift or did not occur on that shift, it has no impact on their probability of presence. It's going to be discussed It's hard to see how that could not be the most reasonable of assumptions. We're assuming they were not involved in any way, you know.
So, this gives us our presence. Then, the only other thing we need is this.
If I do the history I think everyone knows about histograms, even if you don't like statistics. You probably I'm not saying you like histograms, but you've probably seen them. You know what they are. This is just giving us an estimate of the probability distribution for zero I'm sorry, that's one event, two, three. The presence at one, presence at two, presence at three, et cetera.
And all I'm doing just to make my calculations easier, I'm fitting this red line, which is just going to give me an estimate of the probabilities I need to work out what's the probability of an unaccused nurse being present for one, two, three, four out of 61. What is their chances of being there for up to 25 events? Well, it's right as you can see, it's rather small. And then the question is, well, how does this compare for Lucy?
The first thing I want to point out just a little parenthesis here, there has been some criticism on on using that red line. People say, "Well, you should do something different."
Um we addressed that criticism. We just looked at what the implications are if we resample from all of that data. And the as you can see, it it's it's the same. You're not going to get anything any different.
And also, there is a technique I call it Rubin's bootstrap. It's It's known in the literature, unfortunately, in my view at least, as the Bayesian bootstrap. Nothing whatsoever to do with Bayes.
Um and for various odd reasons, I think Rubin chose to call it Maybe it was just to get it published cuz Bayesians have a lot of influence. And so, for for reason There are some technical arguments, a bit strange, but we can use the raw data, which means we're doing an analysis which is purely non-parametric.
There is no parametric assumptions being made. So, these are the grounds upon which people will often attack an analysis. Oh, you assumed a a normal a log normal a the Poisson whatever it is, we don't know if that was the case.
Okay, so this is non-parametric. I'm not making any of those assumptions.
>> [clears throat] >> Well, what happens when I have the relative risk? The relative risk I can work out and I presented this at the last 19 nurses meeting, and there are some technical steps involved. So, I'm not going to go over that because there won't be enough time.
Um one or two technical steps, but just trust me on this one.
We can work out from this distribution here. That's the probability of, you know, zero out of 61, zero one. Those are the numbers, and this is the probability for the the black line is all nurses aside from nurse Lucy Letby. Okay? And we get this distribution. That's just from what I showed earlier. It's the same, exactly the same.
And then we use the relative risk, and this is just simple elementary modeling in epidemiology. It tells me that the curve for Lucy would look like this.
And there we have it. We compare Lucy with all nurses. What do we see? The probability of having been there for all 25 events, well, it's no longer 100%.
It's rather less. Turns out to be about 9.7% if I remember well. It's certainly a little bit under 10%. We can work that out, and I did work it out, and it's it's it's actually published. So, this work is all published, by the way, um in the journal of um the um what is it? The uh Academy of Forensic Science in the British Academy of Forensic Science.
They have a journal called Medicine, Science, and the Law.
And they published they published in the my work in there. And this is published in that journal.
Okay.
So, there it is. Lucy compared to all nurses, it's nothing like 100% but it is a little bit like um, uh, 9 and 1/2% which is certainly more than the average nurse. Well, we know the average nurse was a mixture of nurses from various uh, levels. Some were agency nurses, some were not working necessarily as much as others. So, that's a variable. So, how about this second comparison? I'm now only going to compare the black line is going to chase the blue line which is Lucy is not changing at all. That's the same.
Um, but the black line does change. And so, all of a sudden, I'm not looking at all nurses anymore. I'm only looking at these I'm sorry, I'm looking at those guys. The top 25%. And by top, I mean the top 25 who worked the most. Those who working the most hours. And we're calling those the top 25. And if I go one further step, I don't I look at the top 15% of nurses, well, there's nothing left. So, in fact, the idea that she was always there one that's just not true.
That's plainly not true. It's published and shown to be not true. It's mathematically not true. So, that statement has no value. Saying she was always there, I'm sorry, it's just it's just uh, untrue. What can we say?
This is inverting things. This is showing what is the probability of um, out of the 61, what's the probability an event being deemed suspicious given your present? You know, it's like tossing the the die. It's the other way around.
We've changed the probabilities the other way around. And this is what we get using those basic assumptions we had. We get this. And of course, you'll see in those 23, which is now Lucy Letby, she's almost the highest, but not quite.
But in any event, whether or not she's the highest, and of course, this simulation could be redone.
Um and she may come out on top using that very biased data. We know that, okay.
But even if she did, even if she did, let's drop this a bit and say she comes out number one.
If you were to show this to a jury, are they going to be impressed by this?
They're not. They're not going to They're not going to impressive there.
This does not jump out of the page like the chart does jump out of the page. And yet, it's using the exact same information. We're using Everything is the same. There's nothing changed about I'm looking at a different angle here.
So, I am accelerating a bit because I know I only have about 10 minutes.
Um the next thing is what I called in a paper, which is not published yet, but I'm I'm trying, called the elephant in the room.
And the elephant in the room is what I'm calling the um suspicious event pool.
And you'll see why that how that matters. Let's look at diagnostic accuracy.
We're going through the time period in question, and this information, by the way, I know a lot of people lack a sympathy for Dr. Dewi Evans.
At the same time, he's given us no end of information. So, I think he he gave this he he really does. I think he gave this to Peter Elston, who gave it to me.
So, the period of under study that was that were was being looked at uh it it included 792 shifts. So, we're saying, "Okay, 792 shifts we're looking at 25 adverse events."
Now, as we're looking at an adverse, there's two possibilities. You see an adverse event, and you judge it to be an adverse event. An adverse event is a suspicious event, if you like.
Um we see that and we say, "Ah, how we got it right." Or you see an an unsuspicious event and you judge it.
Those are the correct judgments. So, we're saying that those correct judgments, you are right 99% of the time.
If you are, the probability of getting those 25 events is is less than five in 10,000. In other words, you'll never get those 25 events. Impossible. It's impossible to get them. If you're going through the whole year and you're looking for the 25 adverse events or suspicious events and you're trying to locate them, you are going to fail. And that is with a specificity and a sensitivity which is way off the charts.
I mean, my own limited research, you know, most of you either nurses or doctors or you're in the health, you know a lot more than I do. But my reading that I could find is that the the the neonatal pathologist, when it comes to deciding the cause of death, the probability of getting it right is not high. I think it varies between 50%. I think the very highest number I got was about 70-something, 72%. That was the very highest. You can find it. You say, "Well, this is something different." But I don't think it is that that's that different because we know that all sorts of changes and things have been redefined and um the the the the you know, this is a totally unrealistic figure. And if we come up with a more realistic figure, which would be the the most accurate diagnostic number available, then this is one in billions, one in billions. So, it just didn't happen. Put it like that. That simply cannot happen.
Okay. So, the next one. Here's the one slide you've all been waiting for.
And but I wish I had my pointer.
What I'm interested in the is in the following. So, bear with me if you can.
It's just one slide. I'm interested in the event pool, which is 790 events. How many of those events were suspicious?
How many?
You know, was it was it really just 25?
Well, we know no no it wasn't. It's impossible. It could impossible to have found there's 25. So, it must have been more than 25. How much more? So, the question we want to know is, okay, K this is an unknown parameter which I'm going to estimate using a very standard basic well-known um statistical distribution known as the hypergeometric. For those who know about binomial distribution, it's very similar to that, only when you get a sample of something, you put it back. That's binomial.
And what we do is we look at the empirical distribution which we have from the chart. So, the chart contains a phenomenal amount of information. Not the information we all take away. We all look at that lines, "Aha, that's it."
No, that's the only thing we shouldn't look at because it doesn't tell us anything. But, the rest of the information on the nurses tells us an awful lot. Tells how often they're present, the rates of presents, and it tells us this empirical distribution which I can then compare with the um F which is called FYK. That's the um model, if you like, the theoretical model which contains the parameter K which I do not know. I don't know how many the the how many suspicious events there are. I just don't know. But, I'm going to try and estimate it. You can imagine if there's nothing but suspicious events, then it's very easy to find the 25. But, if there's you know, less, then there's more of a challenge. So, that's it. Now, one, you know, math stats slide is done.
And um using the table, using all of this information in the table, what do we find? We find K equals 93. That's our best estimate. You actually but it's slightly biased downwards. The true value of K is going to be higher. So, that is the number of suspicious events in the what I call the suspicious event pool.
Okay, now and this relates to what Steve was saying this morning, very much so.
If I decide in advance that I'm going to build a table in exactly the same way that that table was built against Lucy Letby, you know, I'm going to use I'm going to allow those kind of biases uh to to dominate. If I look at the you say, "Ah, she wasn't there that day."
Well, probably probably wasn't as suspicious as as I thought. This is exactly what happened. So, now I'm going to do the very same thing. Only, you know what? My gut feeling tells me it wasn't nurse 23, but it was a nurse 34.
Now, if I do that, lo and behold, this is exactly what you get.
So, what does this tell me? Well, it tells me you can frame anyone you want.
Pretty much pretty much. They have to have had sufficient presence in order to be able to construct this chart. You'll see I run out and I'm not sure if everyone can see the bottom. It stops at 24 events because uh we were out the the nurse 34 didn't have any more. So, we were done. But, it's it's not as impressive as 25, but it's pretty good. It's pretty close. And if the jury had been shown the same thing, I don't see any reason why they would have come to a different conclusion than the one they came to.
Only would have been for somebody else.
Okay. So, I'm going to wrap up I think in the next minute or two.
The collapse of the prosecution's case.
So, I there's only one or two things.
The expert witness, he can really insist there are 25 There would only be 25.
Maybe maybe as much as 35, you know, at a stretch. Um but, if that's the case, we can simply calculate the probability of identifying those events correctly, and it's negligible. As I said, it's one It's one in millions. It can't It's impossible. That is simply impossible.
So, assuming that the prosecutor agrees that there are more than 25, there is something of an event pool, which is by the way supported by Dewi Evans himself.
He said something like, "There are more events." So, I think he was going to present them, but they never got that far. There are, we know for a fact that there are more. And of course, in in David Rose's piece in Redacted, in uh what is it called? I'm not sure what it's called. But, he wrote with uh Peter Elston, I think, and he they identified at least 10 additional events. So, I'm estimating them statistically, I find 92.
You might say, "Well, it could be more, could be less." Of course, it's a it's an estimate. Every estimate is subject to noise, [snorts] error, but based on all the data we have. So, that is the best estimate we can come up with. So, based on that, if we get the prosecutor to agree, we have this suspicious event pool, then there are two questions we need to ask.
What are the questions? Number one.
The great majority of suspicious events, three out of four, were never used. They were discarded, or they were never used.
Only one out of four was used. Fine.
What was the basis for that?
Three out of four suspicious events never used, one out of four used. I think we know I think we can sort of, you know, guess what that answer might be. But, um that would be an a question to put them. And then, of course, that This is it. To what extent was the information on the presence of the suspected nurse used to make those decisions? Okay. So, we're getting close to the last slide.
The last slide was everything really pointing at Lucy Letby um is contained in that chart which was shown to the jury.
And what can we say about that chart?
Well, we can say the following.
That chart is a fake, a complete fake, a provable fake, mathematical proof. So, the proofs are given in this published papers. They're not assertions. I presented this 2 years ago, by the way, at the Royal Society and nobody got excited and said, "Oh, that's great." But, they didn't say they were not happy, either, you know. So, I was backing it up with my um um a lot of indications.
But, since then, we have hard mathematical proof which gone into the paper, which is in the journal. So, if somebody wants to say they believe this is not fake, then that's fine. I'm very happy that people contest things. But, then you need challenge what's written because it's written using uh basic mathematics, but everything is backed up, everything is supported, and it shows that to be uh completely fake.
>> [clears throat] >> Thank you.
>> [applause] [applause]
Related Videos

Solving a 'Harvard' University entrance exam question
AsadInternationalAcademy
125 views•2026-06-14

Algorithms for Generalized Signed Distance and Winding Numbers (PhD thesis)
NicoleZFeng
269 views•2026-06-15

Notes 6.3 Rectangle, Rhombus, Square
matthewmills6952
1K views•2026-06-18

Does the math actually hold up? Let's break down the logic.
rawXopinion
1K views•2026-06-15

NYT Hard Sudoku Walkthrough | June 17, 2026
Rangsk
2K views•2026-06-17
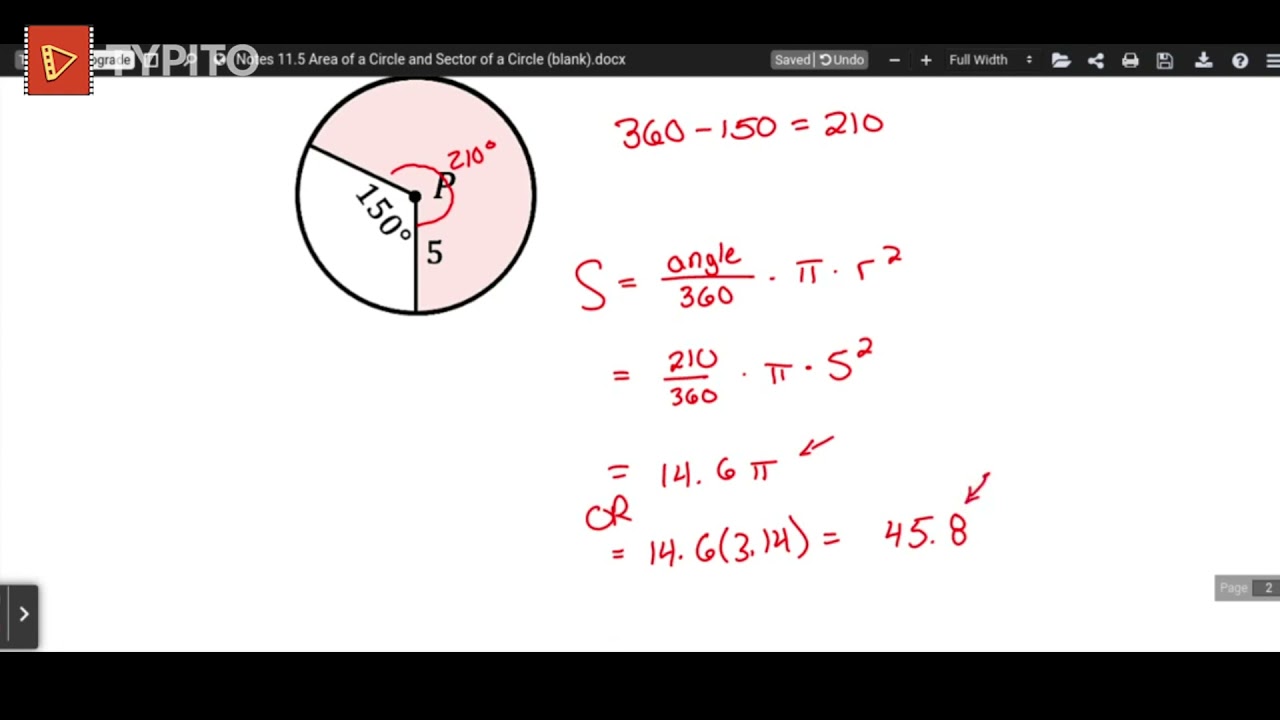
Notes 11.5 Area of a Circle and Sector of a Circle
matthewmills6952
251 views•2026-06-18

Notes 4.2 Isosceles and Equilateral Triangles
matthewmills6952
444 views•2026-06-18
Can You Solve This?
brain_station_videos
1K views•2026-06-15


